Agilicus AnyX Frequently Asked Questions
AnyX – Initial Setup
Agilicus AnyX requires modern cryptography with a strong chain of trust. This is achieved using Let’s Encrypt.
Some older Microsoft Windows systems are not updated to have the proper cryptographic trust information installed. You should upgrade your Windows installation, but, if this is not possible, you can manually install the certificates.
First, download the .der file from https://letsencrypt.org/certificates for each of ‘X1 & X2‘.
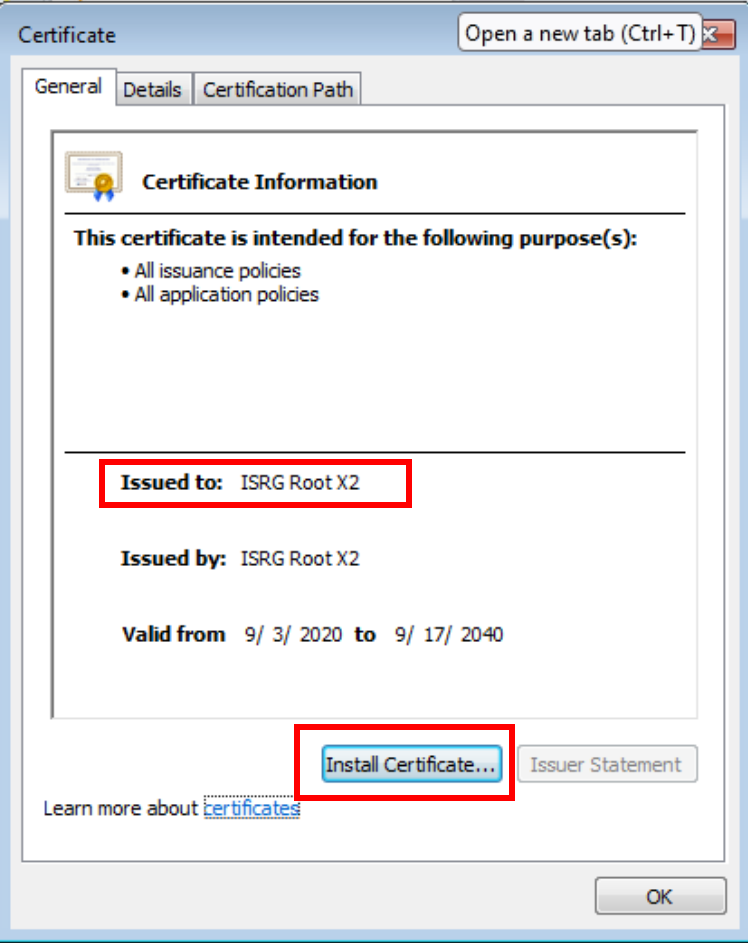
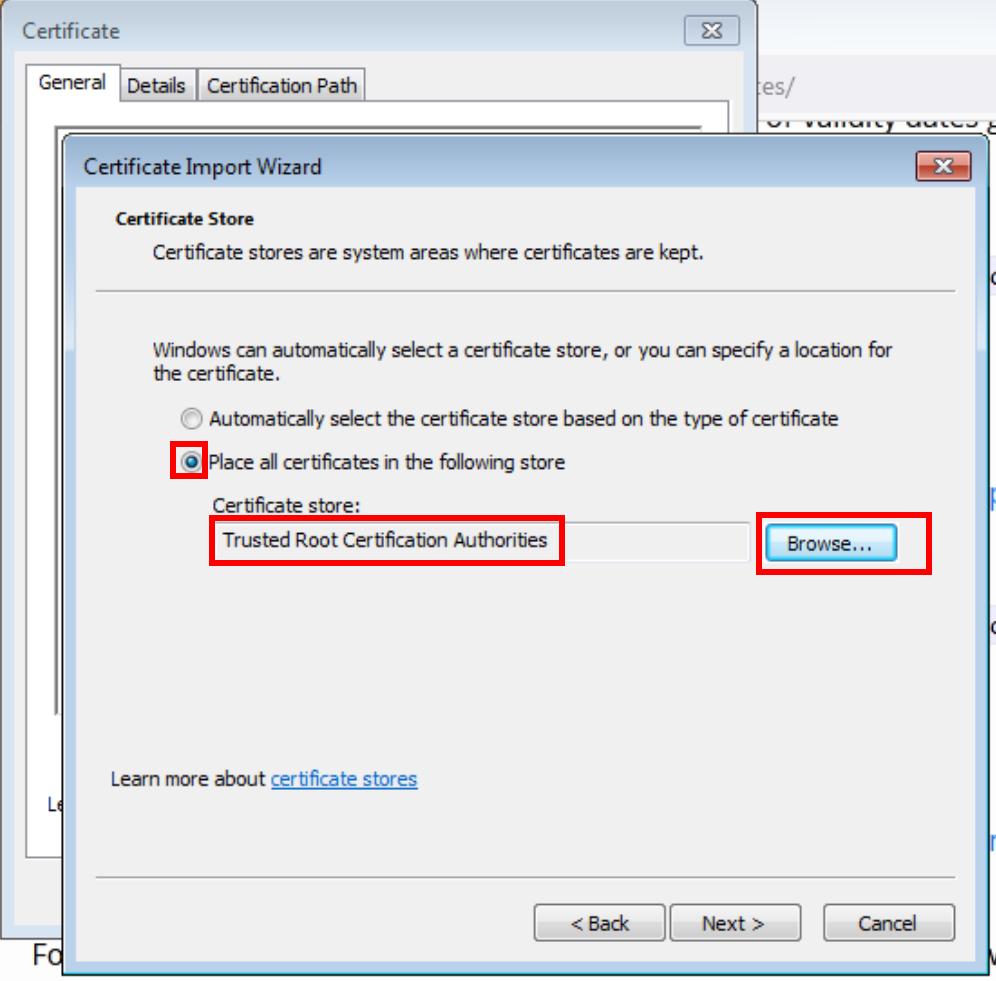
For the X1 der and X2 der, open these on your desktop. You will be prompted to open the certificate manager. From here, Install, and pick the “Trusted Root Certification Authorities”.
Now we must import these to the Machine trust as well (above we did your user). To do so, open ‘mmc’
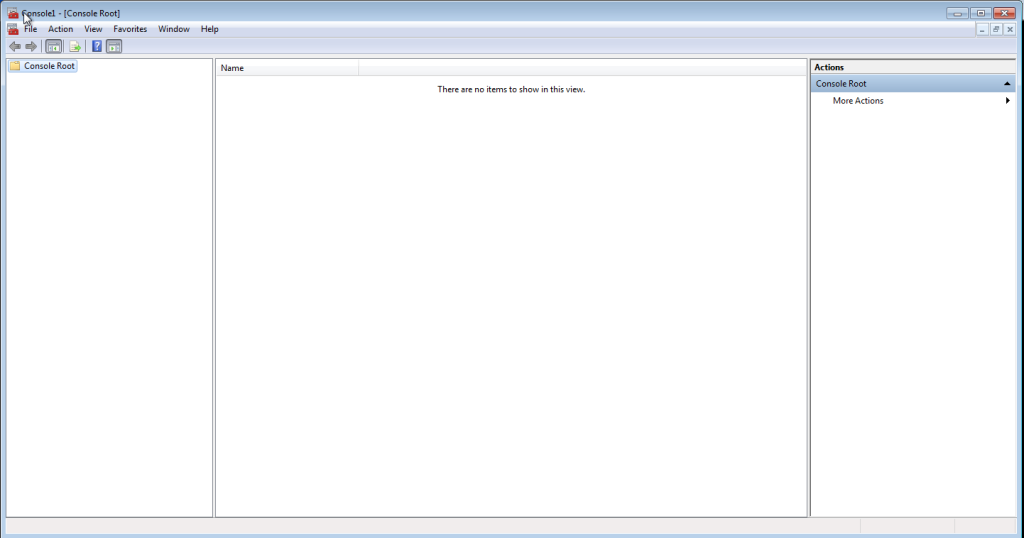
Now press ‘Control-M’.
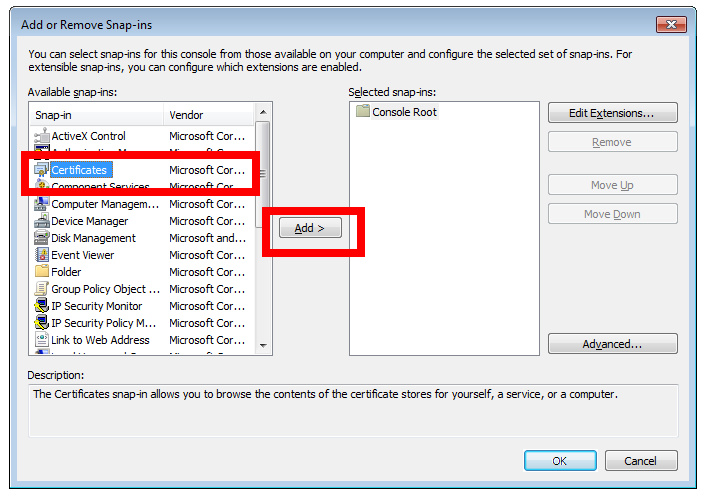


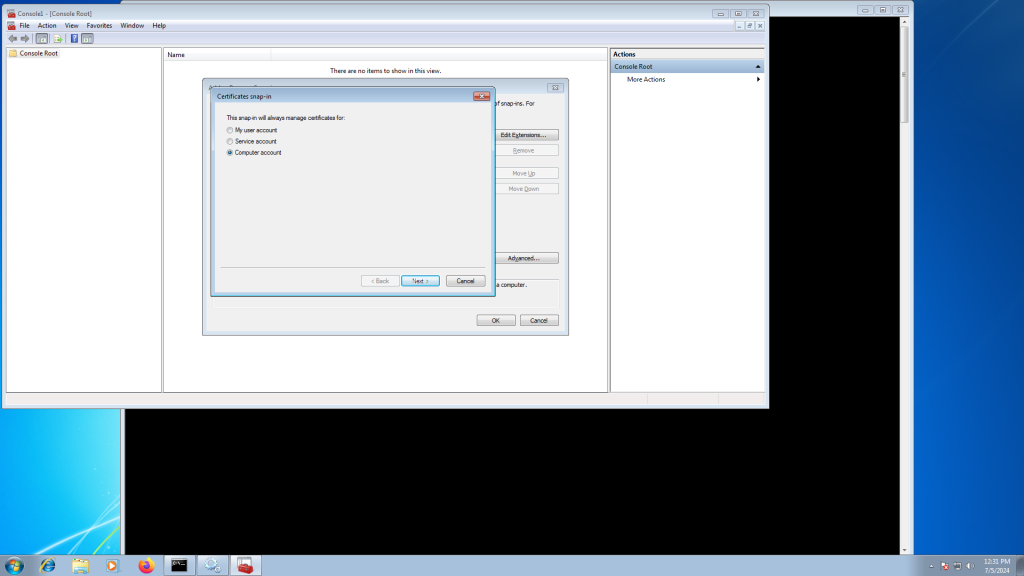
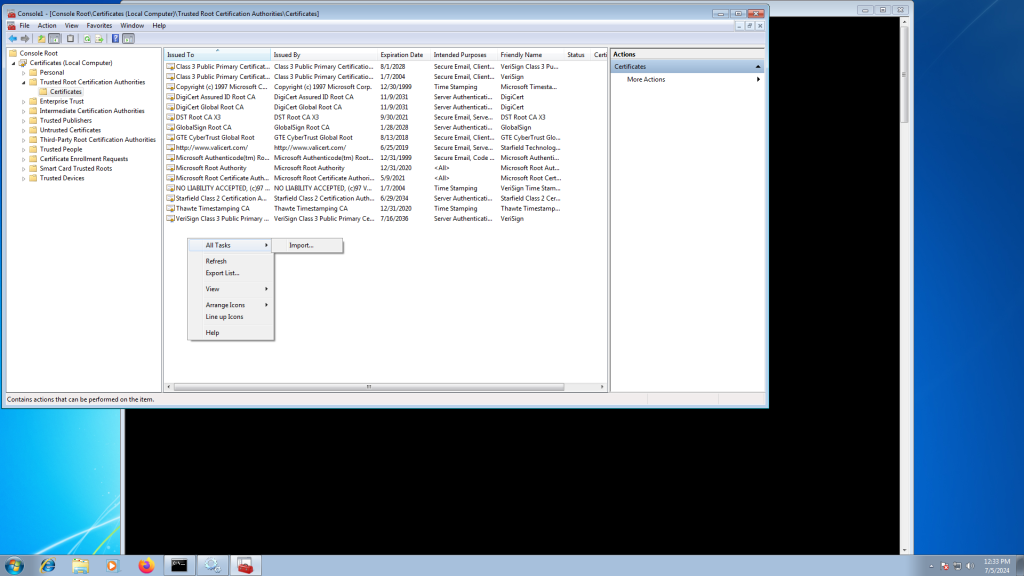
Select the X1 (and repeat for X2) certificate from earlier.
At this stage you should be able to install the Agilicus Connector.
Some customers have issues with their outbound or next-generation firewall. It might block their new domain name they use with Agilicus AnyX (e.g. connect.mydomain.com). We recommend configuring your firewall by hostname if possible. If it must be by IP, this could theoretically change in the future.
See “Firewall Configuration” for the specific rules.
Authentication, User Permissions
The most common error is that a user is trying to log in with the wrong account. Make sure that they are using the correct login and domain. You can use the Authentication Audit page under Organization to review authentication attempts. See diagnosing user issues with audits for more information.
You have a new team member, or a new vendor supporting you. You wish to add them so they have specific permissions.
- Navigate to your admin interface (https://admin.__MYDOMAIN__)
- Under Access/Users, type in their email. Optional: add one or more group assignments for permission
- Optional: Navigate to Access/Groups and add them to one or more group assignments for permissions
- Optional: Navigate to Access/Resource Permissions, and directly assign permissions if not done through a group above.
If you use Microsoft/Azure Entra/Active Directory you can automatically create your users, and automatically assign their groups based on those in Entra. You can in turn assign permissions to those groups. This can fully automate end-user management.
To do this, you will create a Microsoft Application Registration, configure Agilicus AnyX to use it, and then enable the group claim.
See more information on Entra group integration.
See more information on Groups.
Using this technique you can have a 0-configuration, ongoing up-to-date system, where your users are entirely managed by Azure Entra and synced into Agilicus AnyX without ongoing maintenance.
Depending on your settings in Active Directory, you may either have:
- no application consent dialog
- an application consent dialog one time
- an application consent dialog one time per user
In some circumstances it might be one time per user per login. We encourage you to resolve this with your settings in Microsoft Entra, but as a workaround you can try disabling Offline Consent (as below). This will disable the use of Refresh Tokens, which in turn means the user might have to sign in more frequently.

You enable a different policy for sub-organisations by choosing “Enable Unique Issuer” in the actions menu of the “Organiastions/Sub-Organisations Overview” page of your administrative portal. See https://www.agilicus.com/anyx-guide/organisation/ for details. Note that this will change how users of this sub-organisation log in to their profile and admin portal.
Yes. The default policies contain an entry controlling for how long a user’s session is valid. Once this time has elapsed, the user will be asked to re-authenticate. See https://www.agilicus.com/anyx-guide/authentication-rules/#session-duration for details.
Yes. This setting is configured in the “Authentication/Authentication Policy” screen. See https://www.agilicus.com/anyx-guide/multi-factor-authentication-cfg/#multi-factor-frequency for details
You can write policy requiring that users in one of a list of groups have a second factor registered and enabled. See https://www.agilicus.com/anyx-guide/multi-factor-authentication-cfg/#require-multi-factor for more details.
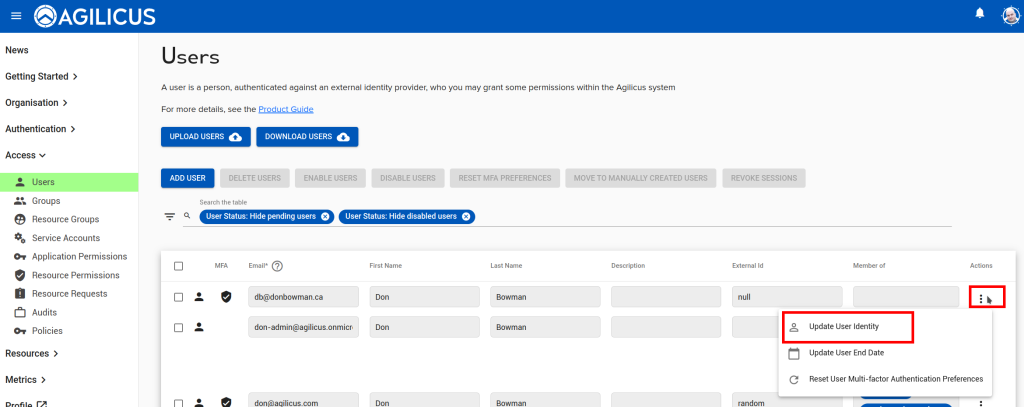
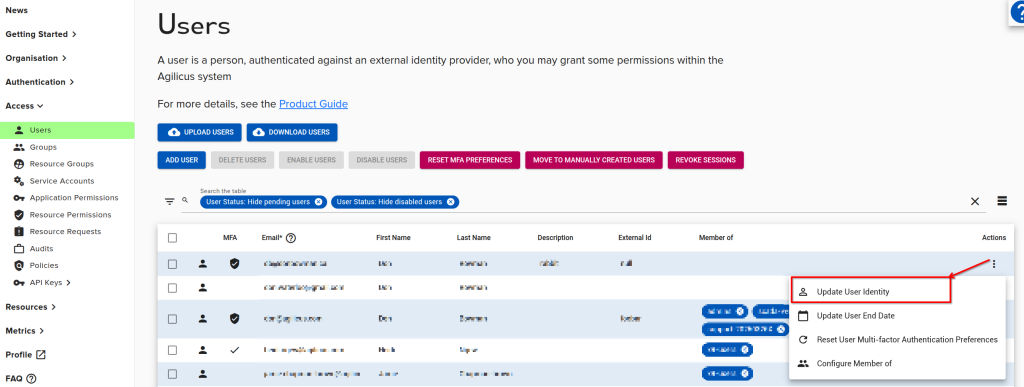
If you have a user who has signed in with one identity provider (e.g. Google) and you wish to change them to another (e.g. Microsoft Azure), or, the user’s email has been changed, use the ‘Update User Identity’ feature. This will disconnect the user from their existing identity provider, and, on their first new sign in, they will be adopted by the new one. Once you have selected thhis option you may change the user’s Email or switch them to a different identity provider.
On the “Access/Resource Permissions” menu in your administrative web interface you can control which users or groups have which permissions on a resource. See “Permissions” for more information.
On the “Authentication/Policy” in your administrative web interface you can control which multi-factor methods your issuer allows. In the “Multi-Factor Authentication Methods Enabled” section, toggle the desired check-boxes to configure which methods your users can choose when enrolling a method, or authenticating.
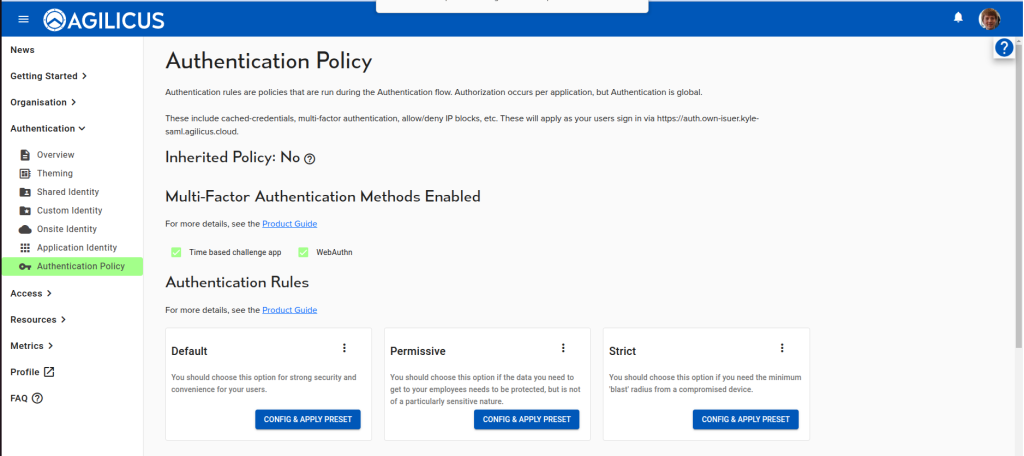
In some circumstances you may have users with more than one account who are struggling to remember to use the correct one. Individually on each sign in they can use the account selector, but, you as the administrator may wish to force this for all users all the time. You may do this as below.
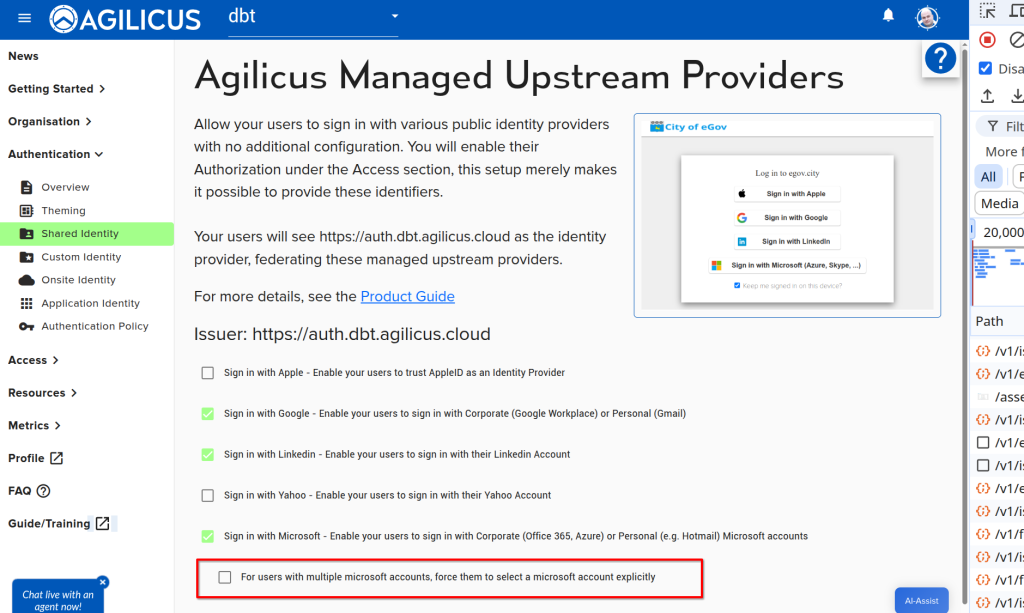
The first time a user authenticates against Microsoft Entra, it may ask for permission to do so. There is no information exchanged, no permission granted to access your Microsoft account, merely permission to authentication. You can configure who this happens for or if it happens at all in the azure console. See Azure Application Consent for more information.
I have a user who has lost their device, how may I reset their multi-factor?
Navigate to access/audits, type in the user email, then search. there is a ‘Reset’ button which will cause the user to require to enter new multi-factor credentials (which they can do at https://profile.__MYDOMAIN__)
A user can only be tied to one Identity provider. In some cases (for example, switching from the Microsoft Shared Identity to a Custom Application Registration) you may wish to reset this association.
This need can also arise if you switch from on-premise Microsoft Active Directory to Microsoft Entra without migrating the users.
To do this, on the users screen, use the action-menu (the 3-dots button on the right), and select ‘Update User Identity’. This will unset the association, which will be recreated on the next sign in.
By default you will have a ‘Shared’ Microsoft Identity Provider enabled. This allows anyone to sign in with any Microsoft account: Azure, Office 365, Outlook.com, etc. This is useful for 3rd parties, vendors, etc.
If you wish to force your users to sign in with your own Azure tenant (e.g. to enable auto-create), you may create a ‘Custom Authentication Issuer’.
You may use Time-Based One-Time Codes (TOTP) (e.g. Google Authenticator, Microsoft Authenticator, Authy, etc), or, any of the standards from the WebAuthn standard set (e.g. USB-based like YubiKey, Passkeys, TPM-based, biometric, etc).
Agilicus AnyX joins together (federates) a set of Identity Providers (IdP). As an end user, you will see this as e.g. ‘Sign In With Google’ or ‘Sign In With Microsoft’. The AnyX platform in turn presents these federated IdP as a new IdP. The Upstream Identity Provider is it original one that the user interacts with (e.g. Microsoft, Google, Active Directory Federation Services, etc).
You should create a bespoke issuer if you want to use your own dedicated source of identity. If you manage users in a google workspace, azure Active Directory or any other Identity provider which supports OpenID Connect (oidc) this is a reasonable choice. If you need access to settings from your own Identity provider. For example, if you want all users on this identity provider to be provisioned automatically, or if you want to use multi-factor authentication from your identity provider itself.
See https://www.agilicus.com/anyx-guide/authentication-issuer/ for more information.
When there are many people that you would like to assign the same resources, use groups in order to put them together
Use a resource group when there’s many different resources that you would like to assign to users together, using a resource group allows you to assign access to several shares, desktops, etc all at once
If your users primarily log on with local Active Directory, this allows users to log in with their normal credentials. See Onsite Identity for more information on onsite identity providers.
The builtin user is very simple to set up than a custom identity provider, so if you want to add users manually, and allow them to log in, this is a great option. It’s especially useful if you have users that aren’t attached to an identity provider you own, for example temporary contractors.
Connector Diagnostics
The connector and the launcher both might observe this error on a Microsoft Windows platform when trying to refresh credentials.
The normal operation of the Launcher is to be automatically refreshed via Profile when the desktop integration is installed. However, if the user does not have the desktop integration, or, the credentials have timed out, they will see the Launcher open a browser to facilitate a refresh.
As part of this flow, the Launcher will open a local TCP port (e.g. port 53210) on localhost.
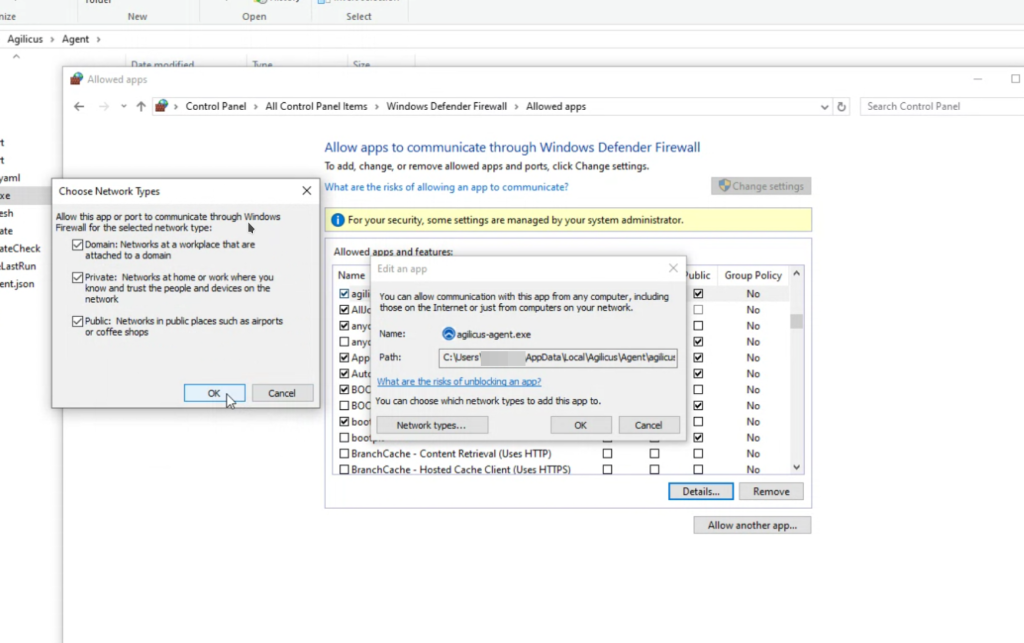
Normally the Windows firewall will allow this since the port is localhost only. However, some environments require the Agilicus Connector & Launcher to be explicitly allowed in the Microsoft Windows firewall. In this case, you might see a message “bind: an attempt was made to access a socket in a way forbidden by its access permissions.”
The Agilicus Connector supports running in an Active/Active high-availability mode, with up to four instances running at a time on separate hardware (and on separate sites with separate Internet connections). This allows you to implement a disaster-recovery scenario.
Note that if the Connector exposes a Share, then it cannot run in Active/Active mode. Instead, consider an approach like a Agilicus Connector Windows Cluster.
Note that each connector in a high-availability set must be able to reach the same upstream services.
Yes. First, you need to enable connector logging in Organisation -> Audit Destinations by clicking the Access and Authorization check-boxes. Your connectors will shortly start streaming their logs to Agilicus. You can see the logs in Applications->Diagnose. Fill in the time range you are interested in, then click View Logs. Note that you may see other logs related to your Organisation here. The relevant ones will have source_type equal to agent-connector
If you see a TLS/SSL certificate when starting (or installing) the connector, it usually indicates there is a SSL-inspecting firewall on site.
If you have a openssl installed, you can run this command:
openssl s_client -showcerts -servername auth.__MYDOMAIN__ -connect auth.__MYDOMAIN__:443 </dev/null
It should emit something like below, note the ISRG Root X1 and the Let’s Encrypt.
root@rtr:~# openssl s_client -showcerts -servername auth.agilicus.com -connect auth.agilicus.com:443 </dev/null
CONNECTED(00000003)
depth=2 C = US, O = Internet Security Research Group, CN = ISRG Root X1
verify return:1
depth=1 C = US, O = Let's Encrypt, CN = R10
verify return:1
depth=0 CN = auth.agilicus.com
verify return:1
---
Certificate chain
 0 s:CN = auth.agilicus.com
   i:C = US, O = Let's Encrypt, CN = R10
   a:PKEY: rsaEncryption, 2048 (bit); sigalg: RSA-SHA256
   v:NotBefore: Feb 13 09:47:07 2025 GMT; NotAfter: May 14 09:47:06 2025 GMT
-----BEGIN CERTIFICATE-----
MIIE8jCCA9qgAwIBAgISA8KDmAmZrQROkCo9atCLeVDYMA0GCSqGSIb3DQEBCwUA
MDMxCzAJBgNVBAYTAlVTMRYwFAYDVQQKEw1MZXQncyBFbmNyeXB0MQwwCgYDVQQD
EwNSMTAwHhcNMjUwMjEzMDk0NzA3WhcNMjUwNTE0MDk0NzA2WjAcMRowGAYDVQQD
ExFhdXRoLmFnaWxpY3VzLmNvbTCCASIwDQYJKoZIhvcNAQEBBQADggEPADCCAQoC
ggEBAL1IA85qUqUSo3jKR6vNgLDRqPYsriX1R7kEoiCZfeMoPnWpia70meCezHy8
BdHs3Vhav1jLQvv3VUa+0ouh61qZMZ5daDnshdn/mgcNlvheqxC7gLBo+uRLuMDA
96w6pm51Mo7UCwj+/CDhDNVbhTG1wCgsgYKZYs4v3epXzLgY1U9U+YH0Y7Lbwq2l
jWw+AOAAozEiOKUMwOQwYut476UOaOkoAUx9tcDAssj4NwJ8mwGUeerZ9larOv0y
Y4NSW/Mc+aIpOotZQ9Qvs3v1z8U5/JWPuUqCyag0pnYs+IZXFo5sZBV/9Mevoyoq
wRjOS4CFfpaVix7x04tlEFxvnRMCAwEAAaOCAhUwggIRMA4GA1UdDwEB/wQEAwIF
oDAdBgNVHSUEFjAUBggrBgEFBQcDAQYIKwYBBQUHAwIwDAYDVR0TAQH/BAIwADAd
BgNVHQ4EFgQUWKF8pzlpBAyy6BgVJ4XYjGclipkwHwYDVR0jBBgwFoAUu7zDR6Xk
vKnGw6RyDBCNojXhyOgwVwYIKwYBBQUHAQEESzBJMCIGCCsGAQUFBzABhhZodHRw
Oi8vcjEwLm8ubGVuY3Iub3JnMCMGCCsGAQUFBzAChhdodHRwOi8vcjEwLmkubGVu
Y3Iub3JnLzAcBgNVHREEFTATghFhdXRoLmFnaWxpY3VzLmNvbTATBgNVHSAEDDAK
MAgGBmeBDAECATCCAQQGCisGAQQB1nkCBAIEgfUEgfIA8AB2AMz7D2qFcQll/pWb
U87psnwi6YVcDZeNtql+VMD+TA2wAAABlP7qBrsAAAQDAEcwRQIhALEu1X27I+ri
KPr8YHbJkoJC5MrRcyty17i1dSsofSv5AiB7Z1So5zkm+P0YoB1YA565NahOS1eo
xCnzBYkhjzcEPQB2AKLjCuRF772tm3447Udnd1PXgluElNcrXhssxLlQpEfnAAAB
lP7qBrMAAAQDAEcwRQIhAL/i58WlCBWAELpFjiDDSLZFTY8HReOhUUN20Srp928b
AiBenIEa3TXkLpROo+s8JLwrSe+3IeStW1461Pm+256ssjANBgkqhkiG9w0BAQsF
AAOCAQEAt7c/TU7oHw4v8KAMzTHicT/uugTty0mdzl8tw+G30TO6SGKdn79ddhPa
052d4S2SoEW1p9r3OrpzjMZEywEG4hN4MS6vsILTKKQ0BFKEjqWkTz5YH+oWjwiJ
ABlaajkTcLbiBk8xcDVR0TpND7sjMAqurRf/cFeuGevsAACdY7S4swMIPp1OXdZb
cSXkZ3ET6NpItL/WfF0JG9ke3OVrtaF9mETG1Hvy/lHkUP2qTSrV3GLqG+tOPEfH
KzQCaDOPHZt9V82finAqRYCOOdeB41REF2uoBrokCc5qm7flyzsUVGhkOuleoorj
utKYMp7QRmHn2LCAgfYctnRoIrm1pA==
-----END CERTIFICATE-----
 1 s:C = US, O = Let's Encrypt, CN = R10
   i:C = US, O = Internet Security Research Group, CN = ISRG Root X1
   a:PKEY: rsaEncryption, 2048 (bit); sigalg: RSA-SHA256
   v:NotBefore: Mar 13 00:00:00 2024 GMT; NotAfter: Mar 12 23:59:59 2027 GMT
-----BEGIN CERTIFICATE-----
MIIFBTCCAu2gAwIBAgIQS6hSk/eaL6JzBkuoBI110DANBgkqhkiG9w0BAQsFADBP
MQswCQYDVQQGEwJVUzEpMCcGA1UEChMgSW50ZXJuZXQgU2VjdXJpdHkgUmVzZWFy
Y2ggR3JvdXAxFTATBgNVBAMTDElTUkcgUm9vdCBYMTAeFw0yNDAzMTMwMDAwMDBa
Fw0yNzAzMTIyMzU5NTlaMDMxCzAJBgNVBAYTAlVTMRYwFAYDVQQKEw1MZXQncyBF
bmNyeXB0MQwwCgYDVQQDEwNSMTAwggEiMA0GCSqGSIb3DQEBAQUAA4IBDwAwggEK
AoIBAQDPV+XmxFQS7bRH/sknWHZGUCiMHT6I3wWd1bUYKb3dtVq/+vbOo76vACFL
YlpaPAEvxVgD9on/jhFD68G14BQHlo9vH9fnuoE5CXVlt8KvGFs3Jijno/QHK20a
/6tYvJWuQP/py1fEtVt/eA0YYbwX51TGu0mRzW4Y0YCF7qZlNrx06rxQTOr8IfM4
FpOUurDTazgGzRYSespSdcitdrLCnF2YRVxvYXvGLe48E1KGAdlX5jgc3421H5KR
mudKHMxFqHJV8LDmowfs/acbZp4/SItxhHFYyTr6717yW0QrPHTnj7JHwQdqzZq3
DZb3EoEmUVQK7GH29/Xi8orIlQ2NAgMBAAGjgfgwgfUwDgYDVR0PAQH/BAQDAgGG
MB0GA1UdJQQWMBQGCCsGAQUFBwMCBggrBgEFBQcDATASBgNVHRMBAf8ECDAGAQH/
AgEAMB0GA1UdDgQWBBS7vMNHpeS8qcbDpHIMEI2iNeHI6DAfBgNVHSMEGDAWgBR5
tFnme7bl5AFzgAiIyBpY9umbbjAyBggrBgEFBQcBAQQmMCQwIgYIKwYBBQUHMAKG
Fmh0dHA6Ly94MS5pLmxlbmNyLm9yZy8wEwYDVR0gBAwwCjAIBgZngQwBAgEwJwYD
VR0fBCAwHjAcoBqgGIYWaHR0cDovL3gxLmMubGVuY3Iub3JnLzANBgkqhkiG9w0B
AQsFAAOCAgEAkrHnQTfreZ2B5s3iJeE6IOmQRJWjgVzPw139vaBw1bGWKCIL0vIo
zwzn1OZDjCQiHcFCktEJr59L9MhwTyAWsVrdAfYf+B9haxQnsHKNY67u4s5Lzzfd
u6PUzeetUK29v+PsPmI2cJkxp+iN3epi4hKu9ZzUPSwMqtCceb7qPVxEbpYxY1p9
1n5PJKBLBX9eb9LU6l8zSxPWV7bK3lG4XaMJgnT9x3ies7msFtpKK5bDtotij/l0
GaKeA97pb5uwD9KgWvaFXMIEt8jVTjLEvwRdvCn294GPDF08U8lAkIv7tghluaQh
1QnlE4SEN4LOECj8dsIGJXpGUk3aU3KkJz9icKy+aUgA+2cP21uh6NcDIS3XyfaZ
QjmDQ993ChII8SXWupQZVBiIpcWO4RqZk3lr7Bz5MUCwzDIA359e57SSq5CCkY0N
4B6Vulk7LktfwrdGNVI5BsC9qqxSwSKgRJeZ9wygIaehbHFHFhcBaMDKpiZlBHyz
rsnnlFXCb5s8HKn5LsUgGvB24L7sGNZP2CX7dhHov+YhD+jozLW2p9W4959Bz2Ei
RmqDtmiXLnzqTpXbI+suyCsohKRg6Un0RC47+cpiVwHiXZAW+cn8eiNIjqbVgXLx
KPpdzvvtTnOPlC7SQZSYmdunr3Bf9b77AiC/ZidstK36dRILKz7OA54=
-----END CERTIFICATE-----
---
Server certificate
subject=CN = auth.agilicus.com
issuer=C = US, O = Let's Encrypt, CN = R10
---
No client certificate CA names sent
Peer signing digest: SHA256
Peer signature type: RSA-PSS
Server Temp Key: X25519, 253 bits
---
SSL handshake has read 3054 bytes and written 403 bytes
Verification: OK
---
New, TLSv1.3, Cipher is TLS_AES_256_GCM_SHA384
Server public key is 2048 bit
Secure Renegotiation IS NOT supported
No ALPN negotiated
Early data was not sent
Verify return code: 0 (ok)
---
DONEYour connector is down, showing “no active tunnel connections to Agilicus”
This typically implies that your connector is running but unable to reach Agilicus. This can mean an issue with your outbound firewall, see Site Firewall Configuration for more information.
The simplest way to diagnose this is to run the built-in self test.
On windows, run the first command below. On Linux simply run ‘agilicus-agent test’ in a shell.
C:\>"C:\Program Files\agilicus\agent\agilicus-agent.exe" test
time="2025-12-15T14:24:28-05:00" level=info msg="Starting test - version v0.317.0"
--- Preflight Tests ---
PASS - https://api.agilicus.com/v1/resolve?type=CNAME&name=ca-1.agilicus.ca
PASS - https://www.agilicus.com/
--- Overall: PASS ---

--- Preflight Tests ---
PASS - https://auth.r.XXX.ca/healthz
PASS - https://auth.r.XXX.ca/healthz @ 34.95.12.47
PASS - https://auth.r.XXX.ca/healthz @ 35.240.184.197
You will also see additional information in the system logs (eventvwr, journalctl, syslog)
If you have an outbound firewall which does TLS/SNI inspection, it may be mis-configured and block connectivity to Agilicus services. You can see the domains required in Site Firewall Configuration.
You can run the network self test (agilicus-agent test) to check connectivity, it may show an error as below. This is showing that your site firewall is sending a TCP RESET (RST) packet when the connector tries to connect to its upstream. Please update the configuration of your firewall to allow the required domains.

You may find that your users, or your connectors, are blocked from connecting to the Agilicus infrastructure by some firewall device on your site.
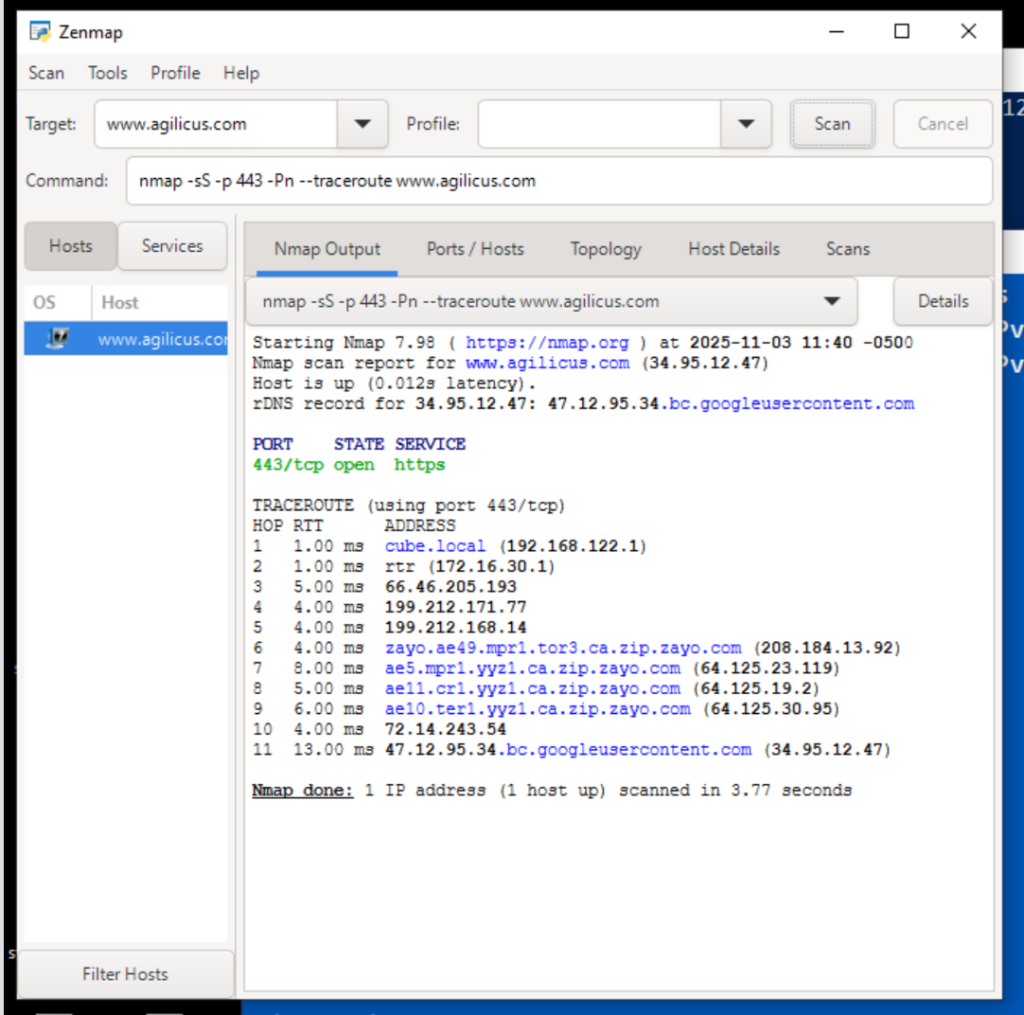
A good tool to try this is Nmap (https://nmap.org/download) and then do a TCP-based traceroute on port 443, using SYN packets. This emulates the connection.
You would use ‘nmap -sS -p 443 -Pn –traceroute admin.__MYDOMAIN__’ similar to the below image.
No it does not. However, given that it will use TCP/IP to connect to them, it needs to be able to route to the IP it determines for the network, and any firewalls in between must allow access to that IP and the target TCP port.
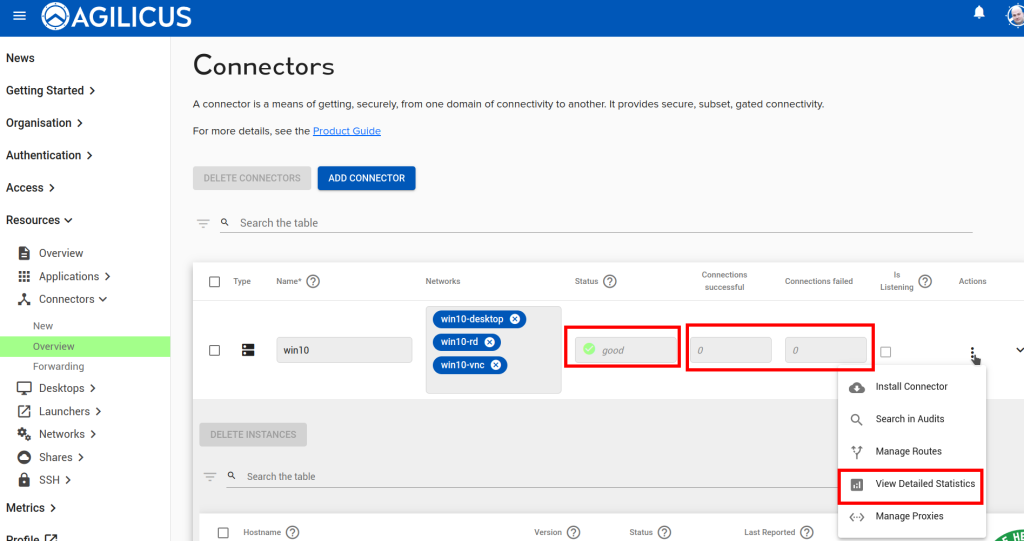
Go to the Connector->Overview screen. Each connector reports an overview status here. “Good” means all instances of the connector are running, and that they are fully connected to Agilicus.
Go to the Connector->Overview screen. Your connectors will shortly begin to publish statistics. You can see a summary
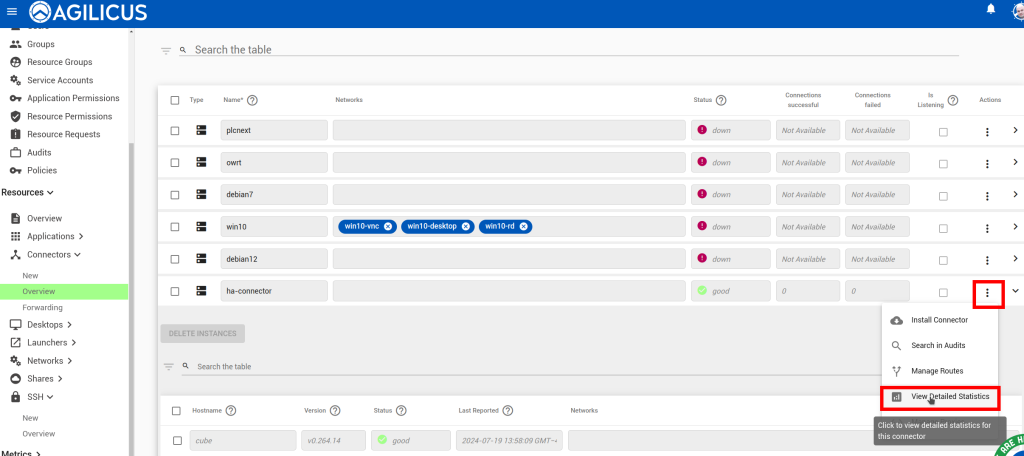
of successful/failed connections in the overview table. Click Actions -> View Detailed Statistics for a breakdown of these stats.
Check that the connector itself is up (the ‘Good’/green in below). After you open the detailed statistics screen, reproduce the problem, and look at which counters increment.

As part of maintaining its connection to Agilicus, the connector reports some system information. In the Connector->Overview screen, click on the connector in which you are interested. The resulting expanded table shows each instance of the connector and the hostname of the machine on which it is running.
When establishing a connection to a Network, the connector first determines an IP with which to communicate with. If an Override IP is present in the Network’s configuration, it will use that. Otherwise, it will use the local system’s DNS configuration to do a DNS lookup of the network’s Hostname. It then establishes a connection to that IP using the local system’s standard TCP/IP stack.
You may have a local firewall which is blocking outbound communication. See ‘Firewall Configuration‘. Check the connector logs (on Windows, using EventViewer, on Linux typically with journalctl -fu agilicus-agent)
Your Network for the HTTP server may be incorrectly configured. The connector proxies HTTP requests at the application layer. If the HTTP server runs HTTPS/TLS, the Network must be configured to initiate an HTTPS/TLS connection, and it must trust the certificate presented by the server. Conversely, if the HTTP server is plaintext (unencrypted), but the connector is configured to expect TLS, it will fail to establish the connection.
In some cases, Agilicus Support might be more effectively able to assist you with a packet capture from the machine running your connector. To do this, we can use Wireshark as below.
Install Wireshark
Open a browser to https://www.wireshark.org/. Select ‘Download’.
![Wireshark Packet Capture For Diagnostics [Windows] 18 Wireshark packet capture on Windows: This screenshot shows the Wireshark interface displaying captured network packets. Use Wireshark for network diagnostics on Windows. Learn how to capture and analyze network traffic with Wireshark.](https://www.agilicus.com/www/00759ec5-image-1024x680.png)
![Wireshark Packet Capture For Diagnostics [Windows] 19 Wireshark Packet Capture in Windows: Diagnose network issues with Wireshark. The screenshot shows the Wireshark interface on Windows, highlighting packet details and filtering options for effective network analysis and troubleshooting. Learn how to use Wireshark for packet capture and analysis on Windows.](https://www.agilicus.com/www/3a2cacd5-image-1024x742.png)
![Wireshark Packet Capture For Diagnostics [Windows] 20 Wireshark packet capture configuration on Windows for network diagnostics. The screenshot shows the Wireshark interface with the capture options menu open, highlighting the selection of the correct network interface and enabling promiscuous mode for comprehensive packet analysis. This setup is essential for troubleshooting network issues and analyzing traffic in detail.](https://www.agilicus.com/www/7ad67511-image.png)
![Wireshark Packet Capture For Diagnostics [Windows] 21 Wireshark Packet Capture on Windows: A step-by-step guide to using Wireshark for network diagnostics on Windows, including selecting the right interface, applying capture filters, and analyzing captured packets to troubleshoot network issues. The screenshot shows the Wireshark interface selection screen, highlighting available network adapters.](https://www.agilicus.com/www/7e574480-image.png)
![Wireshark Packet Capture For Diagnostics [Windows] 22 Wireshark Packet Capture Configuration on Windows: The Wireshark interface is displayed, showing the capture options window. Several network interfaces are listed, and the user has selected the appropriate interface for capturing network traffic. This setup is crucial for diagnosing network issues and analyzing packet data using Wireshark on a Windows system. Learn how to configure Wireshark for effective packet capture on Windows at Agilicus.com.](https://www.agilicus.com/www/fac741ef-image.png)
![Wireshark Packet Capture For Diagnostics [Windows] 23 Wireshark Packet Capture Configuration on Windows: This screenshot guides users on how to set up Wireshark for network diagnostics on Windows, highlighting the interface selection and capture filter settings to effectively analyze network traffic.](https://www.agilicus.com/www/7e209a7a-image.png)
![Wireshark Packet Capture For Diagnostics [Windows] 24 Wireshark Packet Capture Configuration on Windows: A step-by-step guide showing the Wireshark interface with capture filters and settings highlighted for effective network diagnostics. Optimize your network troubleshooting with Wireshark on Windows.](https://www.agilicus.com/www/8f7c540e-image.png)
![Wireshark Packet Capture For Diagnostics [Windows] 25 Wireshark Packet Capture in Windows: Troubleshooting network issues with Wireshark by capturing and analyzing network packets on a Windows machine. Learn how to diagnose and resolve network problems effectively using Wireshark's packet analysis capabilities. The image shows the Wireshark interface on a Windows PC.](https://www.agilicus.com/www/17877f55-image.png)
![Wireshark Packet Capture For Diagnostics [Windows] 26 Wireshark Packet Capture Configuration on Windows: Shows the Wireshark interface with the capture filter set to 'host x.x.x.x' to capture network traffic for diagnostics, focusing on filtering by IP address for efficient troubleshooting.](https://www.agilicus.com/www/64ab64bc-image.png)
![Wireshark Packet Capture For Diagnostics [Windows] 27 Wireshark Packet Capture on Windows: Troubleshooting network issues using Wireshark. The image shows the Wireshark interface with captured packets, highlighting packet details, source/destination IPs, and protocol information. Useful for diagnosing network connectivity and performance problems on Windows systems.](https://www.agilicus.com/www/632180fa-image.png)
![Wireshark Packet Capture For Diagnostics [Windows] 28 Wireshark Packet Capture on Windows: Troubleshooting network issues with Wireshark. Learn how to capture and analyze network packets on Windows for effective diagnostics. This screenshot shows the Wireshark interface with captured packet data, including source and destination IP addresses, protocols, and packet details. Ideal for network administrators and IT professionals seeking to diagnose network performance problems.](https://www.agilicus.com/www/d44a85b5-image.png)
![Wireshark Packet Capture For Diagnostics [Windows] 29 Wireshark packet capture setup on Windows: Shows the Wireshark interface with filters applied, displaying captured network traffic for diagnostic analysis. Focus on capturing specific packets for troubleshooting network issues on Windows systems using Wireshark.](https://www.agilicus.com/www/91bd42f8-image.png)
Open Wireshark, Start Capture
![Wireshark Packet Capture For Diagnostics [Windows] 30 Wireshark Packet Capture Configuration on Windows: Display filter configuration showing how to filter for specific IP addresses and ports for network diagnostics and troubleshooting with Wireshark. This includes configurations for filtering ICMP, TCP, and UDP traffic to capture specific network packets.](https://www.agilicus.com/www/4f1ed4c3-image.png)
Double-click the primary/default network connection.
![Wireshark Packet Capture For Diagnostics [Windows] 31 Wireshark Packet Capture for Diagnostics on Windows: Analyzing network traffic in Wireshark to diagnose network issues. The screenshot shows the Wireshark interface with captured packets, providing a detailed view of network communication for troubleshooting.](https://www.agilicus.com/www/b34b7472-image-1024x545.png)
Now, reproduce the problem, usually a few times. For example, if you have a NVR which is not working, attempt to use it from the Agilicus profile interface.
Now, stop the capture:
![Wireshark Packet Capture For Diagnostics [Windows] 32 Wireshark packet capture on Windows showing captured network traffic for diagnostics and troubleshooting. The Wireshark interface displays packet details, protocols, source and destination IPs, and other network communication data. Used for analyzing network issues with Agilicus.](https://www.agilicus.com/www/ecd05774-image-1024x700.png)
![Wireshark Packet Capture For Diagnostics [Windows] 33 Wireshark Packet Capture on Windows: Diagnosing Network Issues - A screenshot showing the Wireshark interface with captured network packets, used for analyzing and troubleshooting network communication problems in Windows environments. Learn how to use Wireshark for effective network diagnostics.](https://www.agilicus.com/www/089d8762-image-1024x677.png)
![Wireshark Packet Capture For Diagnostics [Windows] 34 Wireshark Packet Capture on Windows: Diagnosing Network Issues with Wireshark - A step-by-step guide to capturing and analyzing network traffic on Windows using Wireshark for effective network diagnostics. Learn how to use Wireshark filters and analyze packet data.](https://www.agilicus.com/www/05122eca-image.png)
Send the Capture to Agilicus
Depending on how long you have captured, this file can be large. Contact Agilicus via the ‘Chat’ interface in the web interface if you need a location to put the file.
Please describe what you were doing, what you observed, what was incorrect, and information about the network.
The end-user receives this message on sign-in:
Message: upstream connection failed
Action: The upstream host could be down
This indicates the Agilicus Connector is up, and the user was able to sign in correctly, however, the customer-supplied application is either down, or unreachable from the Agilicus Connector.

A common issue is a change in IP/port of the application, you may change this as below.
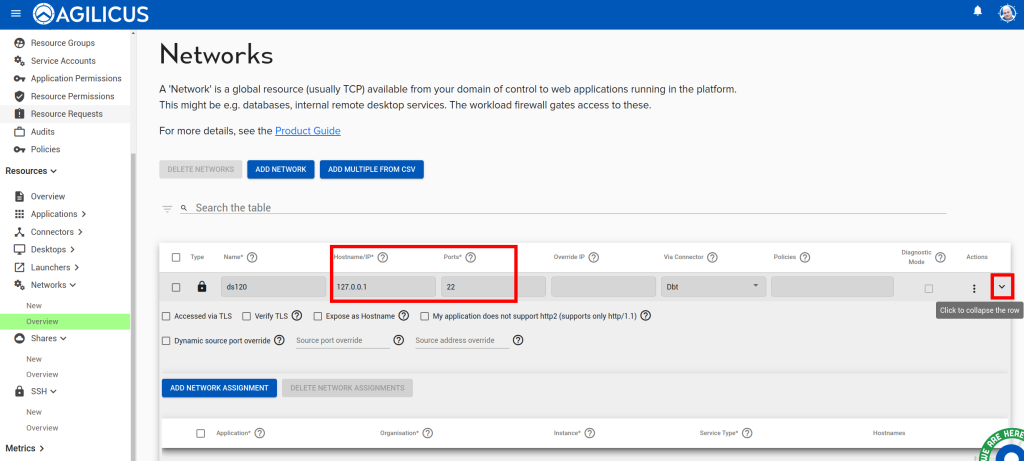
To diagnose the issue, use the detailed stats from the connector overview page:
Connector Installation
Microsoft has discontinued support for Windows 7 and Windows 2012. The Agilicus connector continues to run on these machines, however, it is important to have KB2533623 installed.
If the Windows 7 machine is missing KB2533623, the connector may fail to start. The update can be manually installed from:
https://web.archive.org/web/20200412130407/https://www.microsoft.com/en-us/download/details.aspx?id=26764
Note: it is possible a superceding KB might be installed, e.g. KB3063858 or KB4457144 or KB3063858.
In some cases your air gapped environment does not allow Certificate Revocation List checking. This can occur if you have a server which has never been able to fetch the CRL. This can cause an issue installing, but not running, the Agilicus Connector.
If you see an error like “The revocation function was unable to check revocation for the certificate” when you paste the installation command for the Agilicus Connector, add the parameter “–ssl-no-revoke” to the curl component. This will vary a little bit depending on your platform, but below is an example for a Windows platform:
curl --ssl-no-revoke -sSL -o "%TEMP%\aa.exe" https://www.agilicus.com/www/releases/secure-agent/stable/agilicus-agent.exe && "%TEMP%\aa.exe" client --install --challenge-id XXXX --challenge-code XXXX && del "%TEMP%\aa.exe"Once installed, this will not be a problem again.
If you wish to verify the Agilicus Connector executable, it is digitally signed.
We discuss this problem a bit more, and a generic solution for other components in “Locked-Down Networks Certificate Revocation“. If you are looking for a general purpose secure firewall solution that can forward Certificate Revocation, and only Certificate Revocation (including OCSP) without fixed IP address lists, please contact us, we have a full solution in this area.
Agilicus AnyX requires modern cryptography with a strong chain of trust. This is achieved using Let’s Encrypt.
Some older Microsoft Windows systems are not updated to have the proper cryptographic trust information installed. You should upgrade your Windows installation, but, if this is not possible, you can manually install the certificates.
First, download the .der file from https://letsencrypt.org/certificates for each of ‘X1 & X2‘.
For the X1 der and X2 der, open these on your desktop. You will be prompted to open the certificate manager. From here, Install, and pick the “Trusted Root Certification Authorities”.


Now we must import these to the Machine trust as well (above we did your user). To do so, open ‘mmc’

Now press ‘Control-M’.


Select the X1 (and repeat for X2) certificate from earlier.
At this stage you should be able to install the Agilicus Connector.
The Agilicus connector automatically upgrades, with all connectors skewed in time. Normally this is completed automated and can be ignored.
In some circumstances you may wish to force it to re-evaluate if there is a new version. To achieve this, remove the ‘agilicusLastUpdateCheck’ file, and restart the service.
On windows:
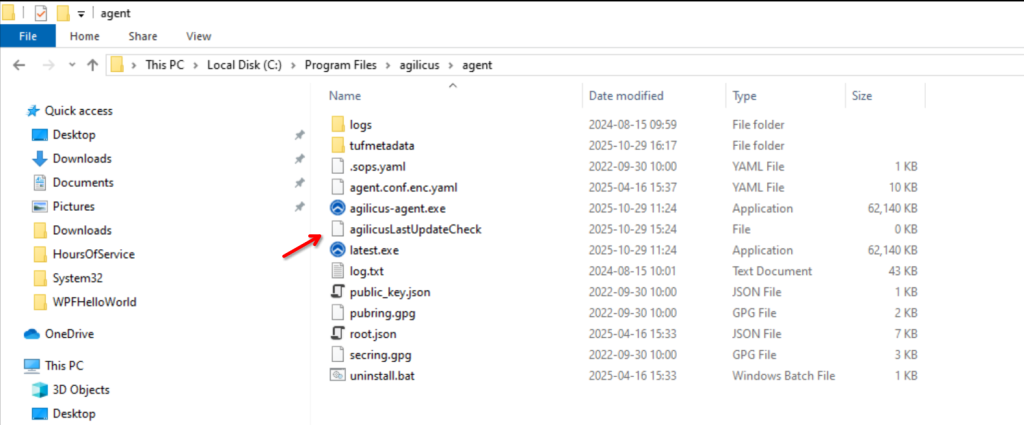
on Linux: rm /opt/agilicus/agent/agilicusLastUpdateCheck
On windows you may restart the service from the windows service manager. On Linux you may use ‘systemctl restart agilicus-agent’.
The connector status can be found by checking the systemctl service status:
$ sudo systemctl status agilicus-agent
The Agilicus Connector runs as a Windows Service. Open the Windows ‘Services’ app and look for ‘Agilicus Connector’. The ‘Service Status’ will show the current status.
Accurate globally synced time is critical to the proper operation of many modern cryptographic tools. It affects certificte allocation/revocation, sign-in audit logs, etc. See https://www.agilicus.com/anyx-guide/time-synchronisation/ for further details to ensure the local machine time synchronization is setup.
Connector logs on Windows can be found in the Windows Event Viewer. Inside Event Viewer (Local) -> Windows Logs -> Application, See “Agilicus Connector – Microsoft Windows“.
The Agilicus Connector needs to be able to reach any service it is used to expose. For a share, this means running on a machine with access to the files. For a Desktop, it means being able to reach via TCP (port 3389 or port 5900 for RDP or VNC typically) the destination system. This might mean running on the same system, this might mean running on a device on the same network segment or inside the same firewall.
When installing the Agilicus Connector you may see an error “tls: failed to verify certificate: x509: certificate signed by unknown authority”. This indicates that your site has a SSL-inspecting firewall present (e.g. Palo Alto, Fortinet, Sophos, etc).
This firewall may be redirecting DNS, or, using some other network-based technique to intercept traffic.
See “Site Firewall Configuration” for hints on how to resolve.
General Diagnostics
End users interact with AnyX via Profile (at https://profile.__MYDOMAIN__). Each resource is represented by an icon. There are 3 ‘tabs’ (mine, requested, all). If an icon does not show in the ‘mine’ tab, but does show in ‘all’, the user is missing permission. If the icon does not show at all, try refreshing the browser.
In some cases you will find that a web application misbehaves on an Android device, but not on a desktop. This can make it more difficult to obtain the console logs to point to the issue. Follow the below instructions to obtain these logs.
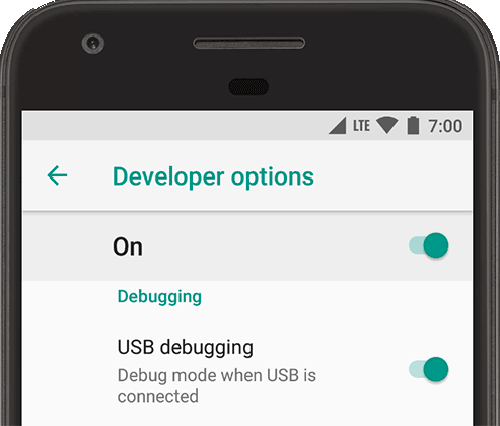
- On the Android device, enable Debugging
- Tap ‘Build Number’ 7 times (Settings > About phone > Software information > Build number)
- Enable “USB” Debugging” under Developer Options
- Plug the Android device into your desktop PC via USB
- If prompted, “Allow USB debugging” when prompted
- On your desktop chrome, open ‘chrome://inspect/#devices’ in the URL bar
- Select ‘Discover USB devices’
- Select your device, click ‘inspect’ (you may need to click the specific URL/tab that is open)
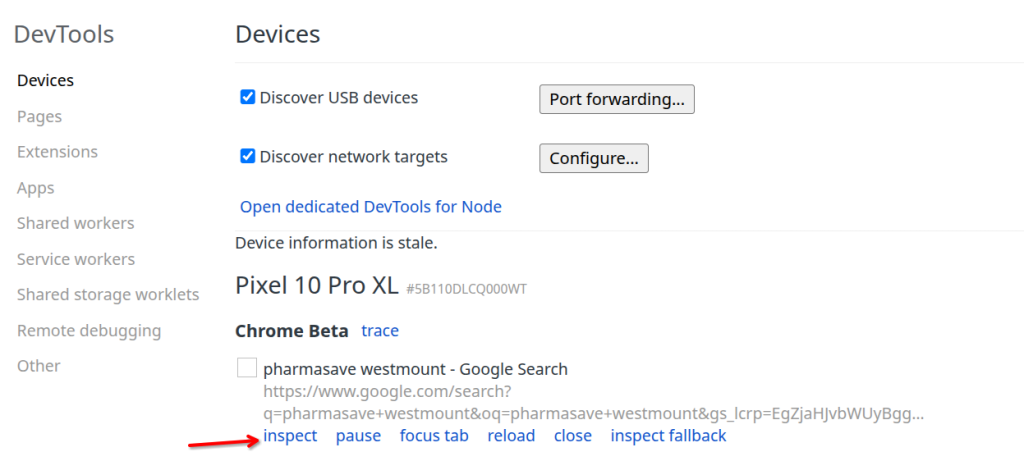
from here you should see the console log and network. You may also wish to save the HAR file for offline diagnostics.
In some circumstances it is more efficient to diagnose a web application issue by generating a HAR file and sharing with Agilicus Support.
Google Chrome (And Derived Browsers Like Microsoft Edge)
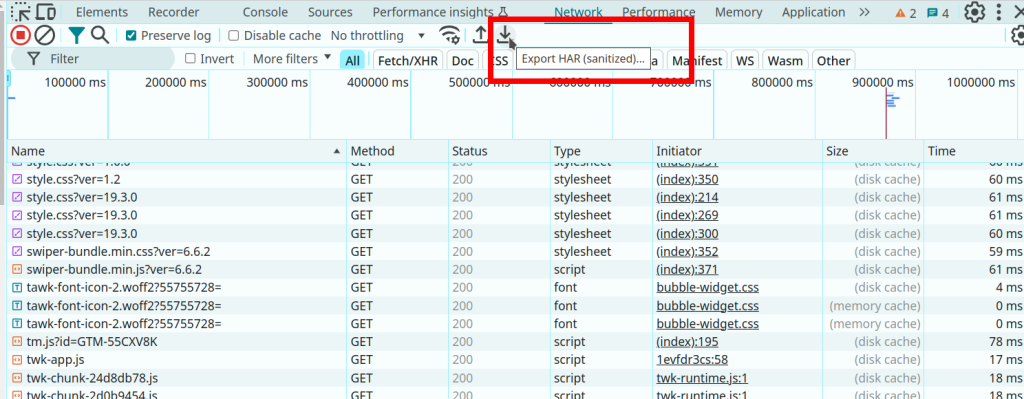
In Google Chrome (and other Chrome-derived browsers such as Microsoft Edge), you can enter the developer mode (ctrl-shift-I or F12), and then select the ‘Export HAR (sanitized)…)’ button.
- Open a new incognito window.
- Click the more actions menu (…) to the right of the toolbar and select More tools – Developer Tools (or press F12 or CTRL-SHIFT-I)
- Select the Network tab.
- Ensure that Google Chrome is recording. A red button indicates that a recording is already in progress. Otherwise, click Record network log.
- Select Preserve Log.
- Clear any existing logs by clicking Clear network log (
 ).
). - Go to the page where the issue occurred and reproduce the issue.
- Click Export HAR (the down arrow icon) to export the file as HAR.
- Save the HAR file.
Firefox
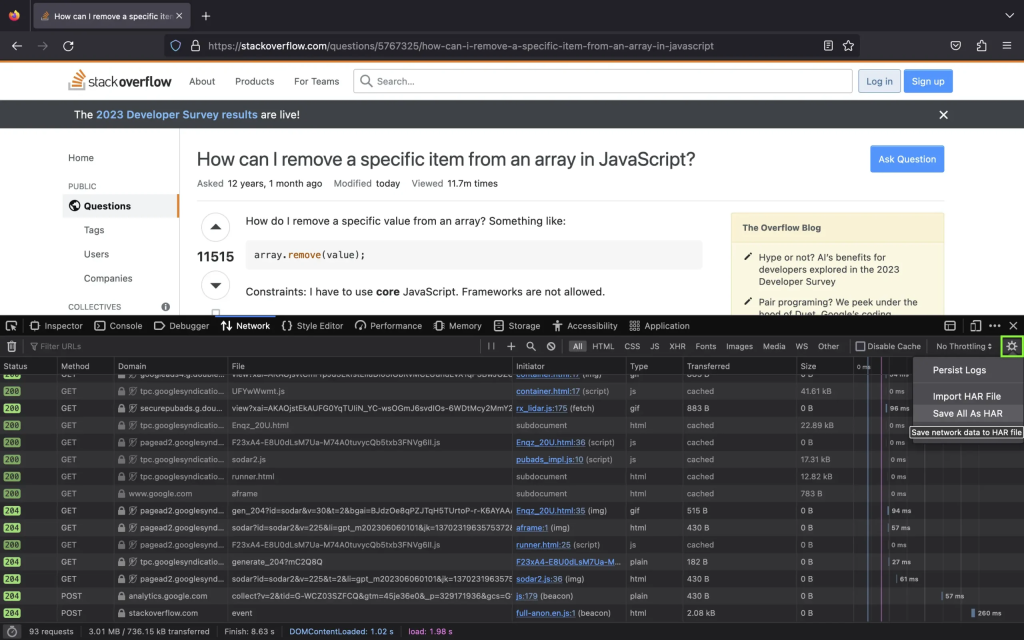
- To open the developer console in Firefox, click on the Firefox Menu in the upper-right-hand corner of the browser and select More Tools > Browser Console. You can also use Option + ⌘ + E (on macOS) or Shift + CTRL + C (on Windows/Linux).
- Refresh the page.
- Go to the Network tab and, click the settings icon (upper right side of the panel), choose Save All As Har.
Apple Safari
Ensure the ”Show Develop menu” in the menu bar is checked under Safari > Settings > Advanced tab.
- Visit the web page from where you want to export the traffic.
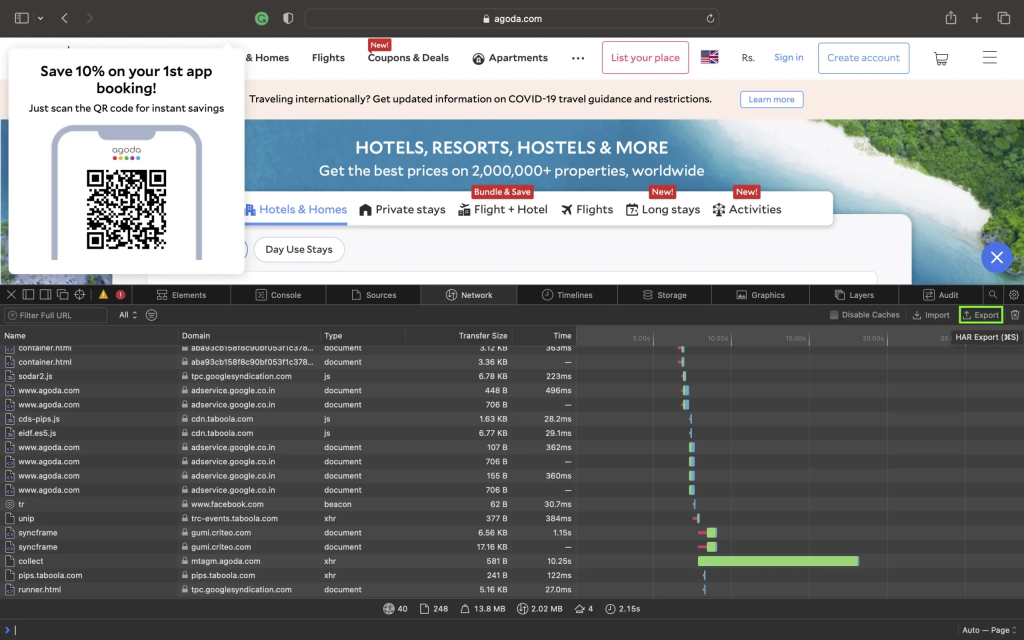
- Click Develop on the Menubar, then select Show Web Inspector. Refresh the page.
- Go to the Network tab and click Export on the upper right side of the pane.
Agilicus has a number of different log sources and types:
- Authentication Audits. See your admin interface, Organisation/Authentication Audit
- API/System change Audits. See your admin interface, Organisation/Audit Subsystem
- Per user diagnostic and access audit: See your admin interface, Access/Audits and enter the user’s email
- External SIEM, graylog, etc. See your admin interface, Organisation/Audit Destinations
- Access logs. See your connector’s log in the OS-dependent fashion (e.g. Eventvwr, Systemd journal)
- (Legacy). For hosted applications, see Applications/Diagnose
For more information on support options, please see Support.
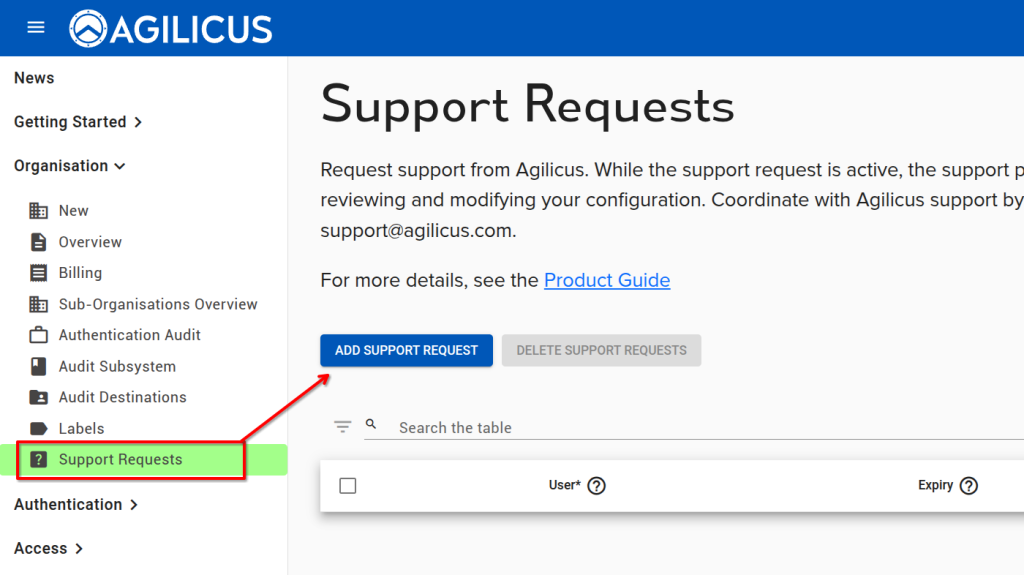
When you are working with a member of the Agilicus customer support team, and wish to give them access to your Organisation in order to collaborate, you may use the Support Requests feature. This will temporarily give a single person access. All activities will show up in the Audits, and you may revoke this permission at any time.
When installing the Agilicus Connector you may see an error “tls: failed to verify certificate: x509: certificate signed by unknown authority”. This indicates that your site has a SSL-inspecting firewall present (e.g. Palo Alto, Fortinet, Sophos, etc).
This firewall may be redirecting DNS, or, using some other network-based technique to intercept traffic.
See “Site Firewall Configuration” for hints on how to resolve.
Industrial Control Systems
Agilicus AnyX allows your existing VNC HMI to be modernised to meet the needs of standards like NIS2: strong encryption, single-sign-on, multi-factor authentication, without changes to your existing equipment or network or infrastructure.
You can see more information on this operates at Zero Trust: VNC Remote Desktop.
Invoices, Billing
See “Organisation/Billing” in your admin portal (https://admin.__MYDOMAIN__). From here, select ‘VIEW/UPDATE PAYMENT INFORMATION”
See “Organisation/Billing” in your admin portal (https://admin.__MYDOMAIN__). From here, select ‘VIEW/UPDATE PAYMENT INFORMATION”
See “Organisation/Billing” in your admin portal (https://admin.__MYDOMAIN__). From here, select ‘VIEW/UPDATE PAYMENT INFORMATION”
Key Concepts
You have a new team member, or a new vendor supporting you. You wish to add them so they have specific permissions.
- Navigate to your admin interface (https://admin.__MYDOMAIN__)
- Under Access/Users, type in their email. Optional: add one or more group assignments for permission
- Optional: Navigate to Access/Groups and add them to one or more group assignments for permissions
- Optional: Navigate to Access/Resource Permissions, and directly assign permissions if not done through a group above.
For more information on support options, please see Support.
When you are working with a member of the Agilicus customer support team, and wish to give them access to your Organisation in order to collaborate, you may use the Support Requests feature. This will temporarily give a single person access. All activities will show up in the Audits, and you may revoke this permission at any time.

When you initially signed up to the Agilicus AnyX platform, you choose a domain (either your own DNS name with a CNAME, or, an Agilicus-supplied domain). Your domain looks something like ORGNAME.agilicus.cloud. You will have received a welcome email with this information, as well as have been automatically signed-in in your browser to e.g. https://admin.__MYDOMAIN__.
Policies
The user may see this error “You have been denied access via a local policy rule such as GeoIP.” on trying to use a resource. This is something your end user will see when opening a web application that is normally available through the Agilicus Connector.
This indicates that a policy has returned false, denying access. This could be a geo-ip policy, a multi-factor authorisation policy, a subnet-based policy, etc.
See Policies, Policy-Based Access Control By Subnet, Geo-Location-Based Access Control and Firewall rules for more information.
If you are the system administrator, you may look at which specific policies apply to the given resource, and, which ones might be matching. Also check the connector logs (overall, windows, Linux)
Resource – Desktops
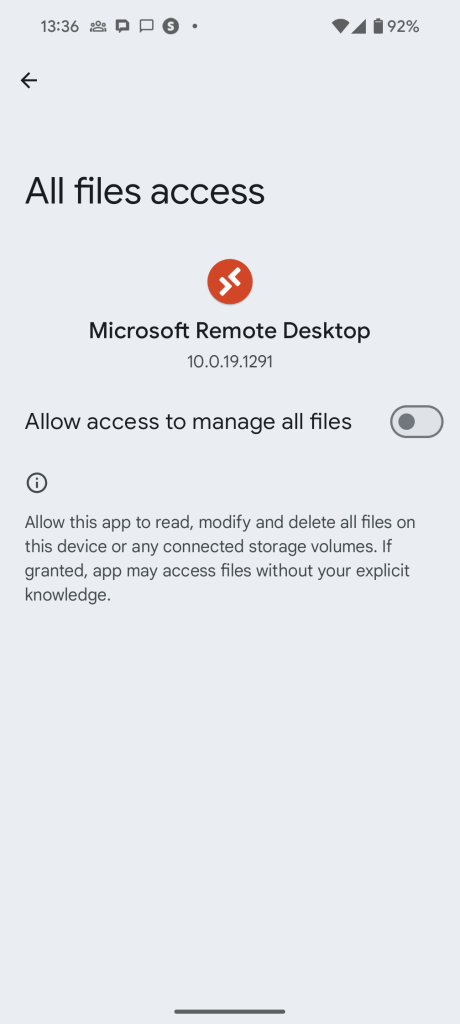
In the Google Play store, install Microsoft Remote Desktop. Once installed, use the Agilicus profile (https://profile.__MYDOMAIN__) and launch the remote desktop icon for your resource.
The first time you run this, you may be asked to grant permission, as below.
If your VNC desktop has credential stuffing enabled (i.e. it has an entry in one of the username or password fields in its expanded configuration under Resources/Desktops), the connector and VNC server must mutually support a protocol which allows for credential exchange. If the connector cannot negotiate a protocol compatible with credential stuffing, it will fail with this message. The following screenshot provides an example. Note the red bar.

The connector supports the following protocols which allow for credential stuffing:
- VNC Authentication (Type 2)
- RA2 (Type 5)
- RA2r (Type 13)
- RA2_256 (Type 129)
To overcome this problem, either disable credential stuffing, or configure the server so that it supports one of the above protocols.
Microsoft supports a concept called ‘Network Level Authentication’. In this model, if the client-machine (running mstsc) is joined to a Windows domain, and, the server is also on the same domain, it will check and enforce this.
With Agilicus AnyX, a common use case is ‘any device’, allowing the user to use a tablet or personal machine to reach a remote desktop server. In this case, the client is not joined to the domain, and, Microsoft Network Level Authentication will fail.
Agilicus AnyX is transparent, and, supports Network Level Authentication. If 100% of your users devices are attached to your domain, you may enable this on your server. If you have users who are not attached to your domain you will need to disable or make it optional on your server.
See the Product Guide for more information.
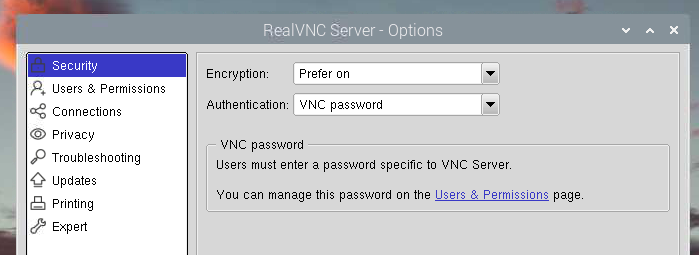
RealVNC® by default uses a proprietary authentication mechanism, rendering it inoperable with standard clients. You can enable standard authentication as shown in the below image (enable VNC Password as an authentication mechanism).
You may also wish to see more detail about how to use the RealVNC as shipped with Raspberry PI.
TightVNC via command line allows specifying the specific display adapter number.
TIghtVNC also allows display offsets in the ‘Extra Ports’ configuration. By specifying a specific port (eg. 5091), a display offset can be configured for a monitor. Once the port is configured and known, a new desktop can be configured in the Agilicus Admin portal with the port number.
Resource – Launchers
Diagnosing a Single PC Issue
If you’re experiencing a problem with your Agilicus Agent on a single PC, these are the primary diagnostic steps you can take:
- Review Log Files:
First, check the contents of the log files located in your agent’s logs directory. These files often contain valuable information about recent activities and errors.- Path:
%LOCALAPPDATA%\Agilicus\Agent\logs - What to look for: Examine the most recent log files for any error messages, warnings, or unexpected behavior.
- Path:
- Run a Debug Refresh:
If the log files don’t reveal the issue, you can force a client refresh with debug logging enabled. This can provide more detailed output about the agent’s operation.- Steps:
- Open a
cmd(Command Prompt) window. - Run the following command:
%LOCALAPPDATA%\Agilicus\Agent\agilicus-agent.exe client --cfg-file %LOCALAPPDATA%\Agilicus\Agent\agent.conf.enc.yaml --client-refresh true --debug
- Open a
- Sharing Results (Optional): If you need to share the results of this debug refresh with Agilicus support, you can append the following to the command to save the output to a file:
%LOCALAPAPPDATA%\Agilicus\Agent\agilicus-agent.exe client --cfg-file %LOCALAPPDATA%\Agilicus\Agent\agent.conf.enc.yaml --client-refresh true --debug > "%USERPROFILE%\Desktop\debug.log" 2>&1
After running this, a file nameddebug.logwill be created on your desktop, which you can then share.
- Steps:
- Debug a Specific Launcher:
If the previous steps don’t identify the problem, you can debug the specific launcher directly. This allows you to see any issues related to its specific command execution.- Steps:
- Locate the shortcut icon for the specific launcher you are having trouble with (e.g., on your desktop or Start Menu).
- Right-click the shortcut and select “Properties.”
- In the “Shortcut” tab, find the “Target” field. This field contains the full command line used to launch the application.
- Copy the entire command line from the “Target” field.
- Open a
cmd(Command Prompt) window as your regular user (not as an administrator). - Paste the copied command line into the
cmdwindow. - Append
--debugto the end of the command line. - Press Enter to run the command.
- This will execute the launcher with debug logging, and any remaining issues or output will be displayed directly in the command prompt window.
- Steps:
You may find there is an issue with the launcher. Examples include:
- application starting but exiting right away
- application starts and gives an error dialog
- application does not start
The first step to diagnose this is to find the debugging output. The simplest way is:
- on Start menu, find the application. ‘Open File Location’
- Right-click on the icon, select ‘Properties’
- Open a ‘cmd’ window (start menu, ‘cmd’)
- run cd “DIR” where dir is the ‘Start In” field. Use double-quotes.
- Run the program, appending –debug to the end of the string
These steps are shown below.
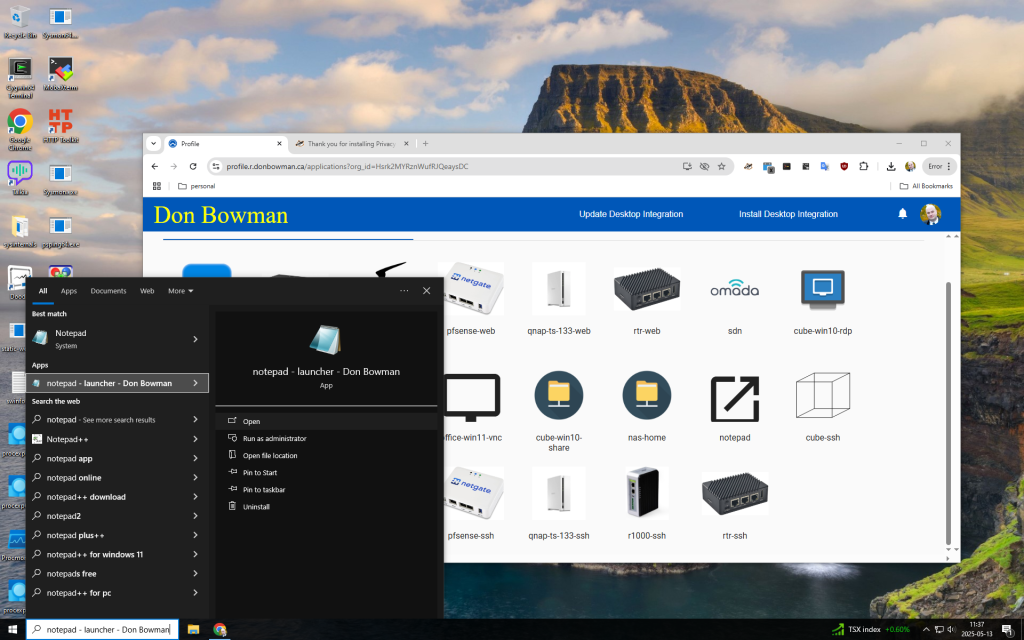
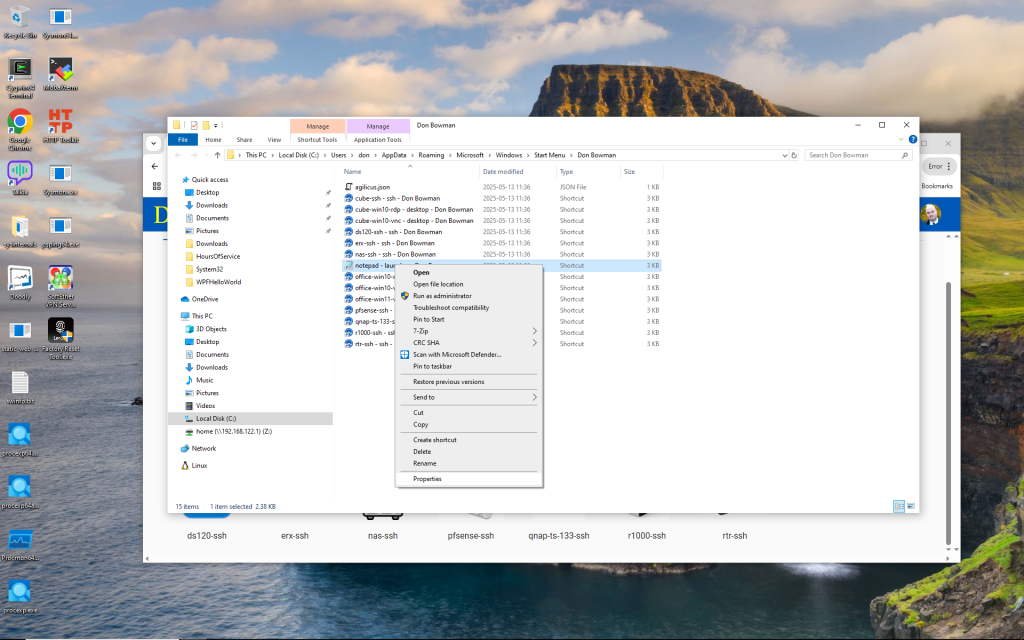
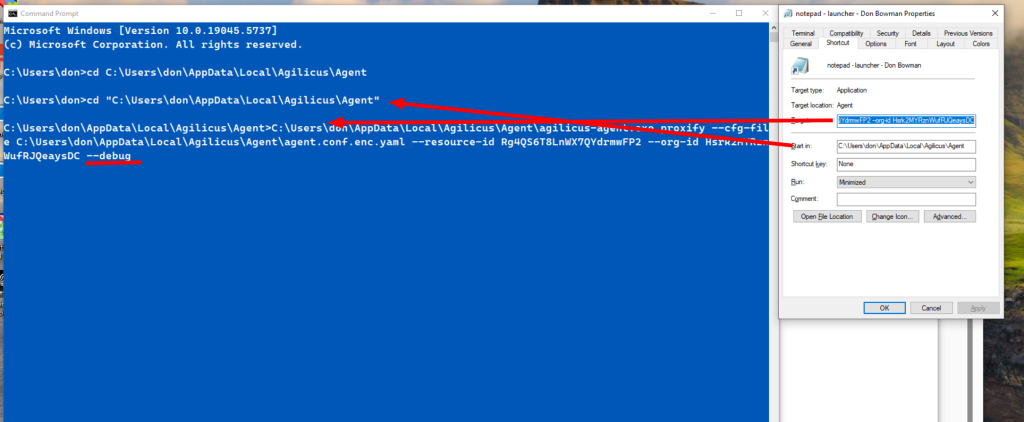
The output will look similar to below.
C:\Users\don\AppData\Local\Agilicus\Agent>C:\Users\don\AppData\Local\Agilicus\Agent\agilicus-agent.exe proxify --cfg-file C:\Users\don\AppData\Local\Agilicus\Agent\agent.conf.enc.yaml --resource-id Rg4QS6T8LnWX7QYdrmwFP2 --org-id Hsrk2MYRznWufRJQeaysDC --debug
time="2025-05-13T11:45:15-04:00" level=info msg="Starting proxify - version v0.298.2"
time="2025-05-13T11:45:15-04:00" level=debug msg="checking if should migrate install path"
time="2025-05-13T11:45:18-04:00" level=debug msg="checking stat file C:\Users\don\AppData\Local\Agilicus\Agent\agilicusLastUpdate"
time="2025-05-13T11:45:18-04:00" level=debug msg="file C:\Users\don\AppData\Local\Agilicus\Agent\agilicusLastUpdate updated"
time="2025-05-13T11:45:18-04:00" level=debug msg="checking C:\Users\don\AppData\Local\Agilicus\Agent\agilicusUpgradeLastRun"
time="2025-05-13T11:45:19-04:00" level=debug msg="upgrade threshold time not met"
time="2025-05-13T11:45:19-04:00" level=debug msg="Launching resource Rg4QS6T8LnWX7QYdrmwFP2 for orgID Hsrk2MYRznWufRJQeaysDC"
time="2025-05-13T11:45:19-04:00" level=debug msg="checking stat file C:\Users\don\AppData\Local\Agilicus\Agent\agilicusLastRefresh"
time="2025-05-13T11:45:19-04:00" level=debug msg="the cache file is: C:\Users\don\AppData\Local\cache\agilicus\resource_info.json"
time="2025-05-13T11:45:19-04:00" level=debug msg="using user resource access info from cache for Rg4QS6T8LnWX7QYdrmwFP2"
time="2025-05-13T11:45:19-04:00" level=debug msg="storing cache in directory: C:\Users\don\AppData\Local\cache\agilicus\tunnel-info"
time="2025-05-13T11:45:19-04:00" level=debug msg="Setting SSL_CERT_FILE=C:\Users\don\AppData\Local\Agilicus\Agent\4274-proxify.crt"
time="2025-05-13T11:45:19-04:00" level=info msg="Adding C:\Users\don\AppData\Local\Agilicus\Agent\4274-proxify.crt to default cert pool"
time="2025-05-13T11:45:19-04:00" level=debug msg="Listen on port 55031"
time="2025-05-13T11:45:19-04:00" level=debug msg="Setting proxy env vars to: http://localhost:55031"
time="2025-05-13T11:45:19-04:00" level=debug msg="Setting _JAVA_OPTIONS var to: -Dhttp.proxyHost=localhost -Dhttp.proxyPort=55031 -Dhttps.proxyHost=localhost -Dhttps.proxyPort=55031"
time="2025-05-13T11:45:19-04:00" level=debug msg="storing cache in directory: C:\Users\don\AppData\Local\cache\agilicus\tunnel-info"
time="2025-05-13T11:45:19-04:00" level=debug msg="exec (waitDescendants: true, workingDir: ): c:\windows\system32\notepad.exe"
d
If you are using an Agilicus Launcher with Rockwell Studio rslinx to reach one or more PLCs, you may see an error “listen tcp 127.74.52.3:44818: bind: An attempt was made to access a socket in a way forbidden by its access permissions.”
This indicates you have another process running which has globally opened this port. You may find this process via:
netstat -an |findstr 44818If you see a result like:
TCP 0.0.0.0:44818 0.0.0.0:0 LISTENINGThis means that there is a process running with this port globally, exclusively, open. You can find the process:
netstat -anband you will see the named process. Stop this process which has the port open exclusively, and, the Agilicus Launcher should now work.
To avoid this, you can either use a different port, reconfigure the exclusive process to use a specific IP (instead of 0.0.0.0), or, run the Agilicus Launcher first.
Resource – Networks
Navigate to Resources/networks. There you will find the ‘network’ (the upstream connection to your application).
Expand the details, from here you can change the TLS settings.
You might see these symptoms, a message:
“Bad Request. Your browser sent a request that this server could not understand. Reason: You’re speaking plain HTTP to an SSL-enabled server port. Instead use the HTTPS scheme to access this URI.”
Resource – Web Applications
If you have an application hosted on a Subfolder/path in your Web Server
You may have an application hosted under a subfolder/path on your web server, possibly because it is better than having another server for it. For example: localhost:port/subpath, localhost:port/support etc.
To enable the subpath hosting for your application,
1. Go to Resources > Applications > Define and select the application from the drop down at the top of the page
2. Then in Security (tab) > Firewall Rules > HTTP Rules, change the / entry under path to your custom subpath (For example, /subpath)
3. Under Proxy (tab) > HTTP Rewrites, inside the Common Path Prefix field, enter your custom subpath again (For example, /subpath)
In some circumstances it is more efficient to diagnose a web application issue by generating a HAR file and sharing with Agilicus Support.
Google Chrome (And Derived Browsers Like Microsoft Edge)
In Google Chrome (and other Chrome-derived browsers such as Microsoft Edge), you can enter the developer mode (ctrl-shift-I or F12), and then select the ‘Export HAR (sanitized)…)’ button.
- Open a new incognito window.
- Click the more actions menu (…) to the right of the toolbar and select More tools – Developer Tools (or press F12 or CTRL-SHIFT-I)
- Select the Network tab.
- Ensure that Google Chrome is recording. A red button indicates that a recording is already in progress. Otherwise, click Record network log.
- Select Preserve Log.
- Clear any existing logs by clicking Clear network log (
 ).
). - Go to the page where the issue occurred and reproduce the issue.
- Click Export HAR (the down arrow icon) to export the file as HAR.
- Save the HAR file.

Firefox
- To open the developer console in Firefox, click on the Firefox Menu in the upper-right-hand corner of the browser and select More Tools > Browser Console. You can also use Option + ⌘ + E (on macOS) or Shift + CTRL + C (on Windows/Linux).
- Refresh the page.
- Go to the Network tab and, click the settings icon (upper right side of the panel), choose Save All As Har.

Apple Safari
Ensure the ”Show Develop menu” in the menu bar is checked under Safari > Settings > Advanced tab.
- Visit the web page from where you want to export the traffic.
- Click Develop on the Menubar, then select Show Web Inspector. Refresh the page.
- Go to the Network tab and click Export on the upper right side of the pane.

Web Applications use network resources. You can change where the network resource is accessed (either the connector it is bound to, or the hostname/IP/port that it is internally known as) by navigating to Networks/Overview.
The specific resource(s) will be named similarly to the web application, with -local-service appended.
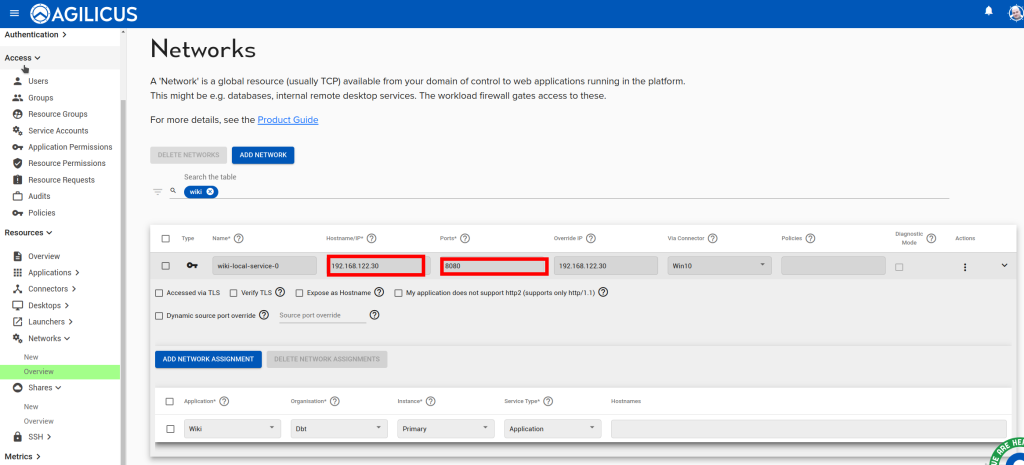
Navigate to Resources/networks. There you will find the ‘network’ (the upstream connection to your application).
Expand the details, from here you can change the TLS settings.
You might see these symptoms, a message:
“Bad Request. Your browser sent a request that this server could not understand. Reason: You’re speaking plain HTTP to an SSL-enabled server port. Instead use the HTTPS scheme to access this URI.”
When using SolarWinds web application through Agilicus AnyX you may find there is information missing in the output screen.
By default, SolarWindows uses a JavaScript file with the IP address embedded in it. You can enable ‘text/javascript’ “rewrite”Rewrite Media Types” in the Agilicus admin interface to resolve this issue.
Navigate to Resources/Applications/Overview. Select your web application. Click on the ‘proxy’ tab, from here select ‘Rewrite Media Types’, add ‘text/javascript’ as below.
Now do a hard reload of your browser on your SolarWinds URL, and it should properly populate.
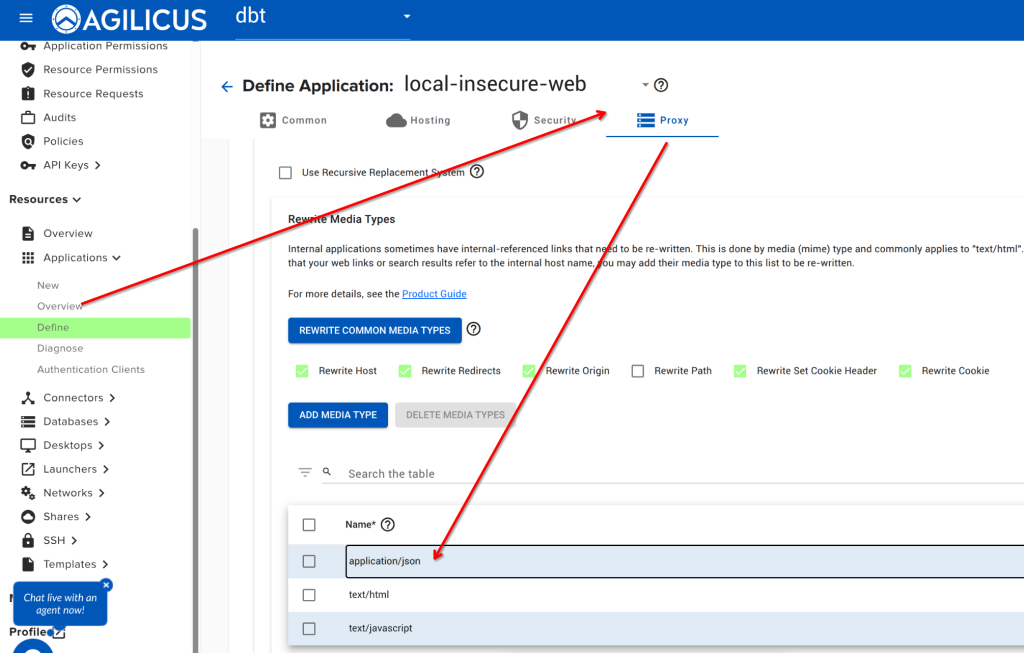
If you are using a custom authentication client id in your web application, or your web application participates in the sign in, you may find you see a message “Message: Unregistered redirect_uri”.
You may find that either:
a) you have selected “my application participates in authentication” and you did not mean this
b) your application does participate, but, you have not added the proper redirect_uri to Resources/Applications/Authentication Clients in admin.
In some cases, Agilicus Support might be more effectively able to assist you with a packet capture from the machine running your connector. To do this, we can use Wireshark as below.
Install Wireshark
Open a browser to https://www.wireshark.org/. Select ‘Download’.
![Wireshark Packet Capture For Diagnostics [Windows] 75 Wireshark packet capture on Windows: This screenshot shows the Wireshark interface displaying captured network packets. Use Wireshark for network diagnostics on Windows. Learn how to capture and analyze network traffic with Wireshark.](https://www.agilicus.com/www/00759ec5-image-1024x680.png)
![Wireshark Packet Capture For Diagnostics [Windows] 76 Wireshark Packet Capture in Windows: Diagnose network issues with Wireshark. The screenshot shows the Wireshark interface on Windows, highlighting packet details and filtering options for effective network analysis and troubleshooting. Learn how to use Wireshark for packet capture and analysis on Windows.](https://www.agilicus.com/www/3a2cacd5-image-1024x742.png)
![Wireshark Packet Capture For Diagnostics [Windows] 77 Wireshark packet capture configuration on Windows for network diagnostics. The screenshot shows the Wireshark interface with the capture options menu open, highlighting the selection of the correct network interface and enabling promiscuous mode for comprehensive packet analysis. This setup is essential for troubleshooting network issues and analyzing traffic in detail.](https://www.agilicus.com/www/7ad67511-image.png)
![Wireshark Packet Capture For Diagnostics [Windows] 78 Wireshark Packet Capture on Windows: A step-by-step guide to using Wireshark for network diagnostics on Windows, including selecting the right interface, applying capture filters, and analyzing captured packets to troubleshoot network issues. The screenshot shows the Wireshark interface selection screen, highlighting available network adapters.](https://www.agilicus.com/www/7e574480-image.png)
![Wireshark Packet Capture For Diagnostics [Windows] 79 Wireshark Packet Capture Configuration on Windows: The Wireshark interface is displayed, showing the capture options window. Several network interfaces are listed, and the user has selected the appropriate interface for capturing network traffic. This setup is crucial for diagnosing network issues and analyzing packet data using Wireshark on a Windows system. Learn how to configure Wireshark for effective packet capture on Windows at Agilicus.com.](https://www.agilicus.com/www/fac741ef-image.png)
![Wireshark Packet Capture For Diagnostics [Windows] 80 Wireshark Packet Capture Configuration on Windows: This screenshot guides users on how to set up Wireshark for network diagnostics on Windows, highlighting the interface selection and capture filter settings to effectively analyze network traffic.](https://www.agilicus.com/www/7e209a7a-image.png)
![Wireshark Packet Capture For Diagnostics [Windows] 81 Wireshark Packet Capture Configuration on Windows: A step-by-step guide showing the Wireshark interface with capture filters and settings highlighted for effective network diagnostics. Optimize your network troubleshooting with Wireshark on Windows.](https://www.agilicus.com/www/8f7c540e-image.png)
![Wireshark Packet Capture For Diagnostics [Windows] 82 Wireshark Packet Capture in Windows: Troubleshooting network issues with Wireshark by capturing and analyzing network packets on a Windows machine. Learn how to diagnose and resolve network problems effectively using Wireshark's packet analysis capabilities. The image shows the Wireshark interface on a Windows PC.](https://www.agilicus.com/www/17877f55-image.png)
![Wireshark Packet Capture For Diagnostics [Windows] 83 Wireshark Packet Capture Configuration on Windows: Shows the Wireshark interface with the capture filter set to 'host x.x.x.x' to capture network traffic for diagnostics, focusing on filtering by IP address for efficient troubleshooting.](https://www.agilicus.com/www/64ab64bc-image.png)
![Wireshark Packet Capture For Diagnostics [Windows] 84 Wireshark Packet Capture on Windows: Troubleshooting network issues using Wireshark. The image shows the Wireshark interface with captured packets, highlighting packet details, source/destination IPs, and protocol information. Useful for diagnosing network connectivity and performance problems on Windows systems.](https://www.agilicus.com/www/632180fa-image.png)
![Wireshark Packet Capture For Diagnostics [Windows] 85 Wireshark Packet Capture on Windows: Troubleshooting network issues with Wireshark. Learn how to capture and analyze network packets on Windows for effective diagnostics. This screenshot shows the Wireshark interface with captured packet data, including source and destination IP addresses, protocols, and packet details. Ideal for network administrators and IT professionals seeking to diagnose network performance problems.](https://www.agilicus.com/www/d44a85b5-image.png)
![Wireshark Packet Capture For Diagnostics [Windows] 86 Wireshark packet capture setup on Windows: Shows the Wireshark interface with filters applied, displaying captured network traffic for diagnostic analysis. Focus on capturing specific packets for troubleshooting network issues on Windows systems using Wireshark.](https://www.agilicus.com/www/91bd42f8-image.png)
Open Wireshark, Start Capture
![Wireshark Packet Capture For Diagnostics [Windows] 87 Wireshark Packet Capture Configuration on Windows: Display filter configuration showing how to filter for specific IP addresses and ports for network diagnostics and troubleshooting with Wireshark. This includes configurations for filtering ICMP, TCP, and UDP traffic to capture specific network packets.](https://www.agilicus.com/www/4f1ed4c3-image.png)
Double-click the primary/default network connection.
![Wireshark Packet Capture For Diagnostics [Windows] 88 Wireshark Packet Capture for Diagnostics on Windows: Analyzing network traffic in Wireshark to diagnose network issues. The screenshot shows the Wireshark interface with captured packets, providing a detailed view of network communication for troubleshooting.](https://www.agilicus.com/www/b34b7472-image-1024x545.png)
Now, reproduce the problem, usually a few times. For example, if you have a NVR which is not working, attempt to use it from the Agilicus profile interface.
Now, stop the capture:
![Wireshark Packet Capture For Diagnostics [Windows] 89 Wireshark packet capture on Windows showing captured network traffic for diagnostics and troubleshooting. The Wireshark interface displays packet details, protocols, source and destination IPs, and other network communication data. Used for analyzing network issues with Agilicus.](https://www.agilicus.com/www/ecd05774-image-1024x700.png)
![Wireshark Packet Capture For Diagnostics [Windows] 90 Wireshark Packet Capture on Windows: Diagnosing Network Issues - A screenshot showing the Wireshark interface with captured network packets, used for analyzing and troubleshooting network communication problems in Windows environments. Learn how to use Wireshark for effective network diagnostics.](https://www.agilicus.com/www/089d8762-image-1024x677.png)
![Wireshark Packet Capture For Diagnostics [Windows] 91 Wireshark Packet Capture on Windows: Diagnosing Network Issues with Wireshark - A step-by-step guide to capturing and analyzing network traffic on Windows using Wireshark for effective network diagnostics. Learn how to use Wireshark filters and analyze packet data.](https://www.agilicus.com/www/05122eca-image.png)
Send the Capture to Agilicus
Depending on how long you have captured, this file can be large. Contact Agilicus via the ‘Chat’ interface in the web interface if you need a location to put the file.
Please describe what you were doing, what you observed, what was incorrect, and information about the network.
Resources
You can set the icon profile show for any resource type:
- ssh
- desktop
- web application
- launcher
Navigate to Resources/Overview, select the icon for the given resource and upload a PNG or JPG or SVG file that is square in aspect ratio (e.g. 256×256, 64×64, etc).
You can then test the icon by navigating to profile and refreshing.
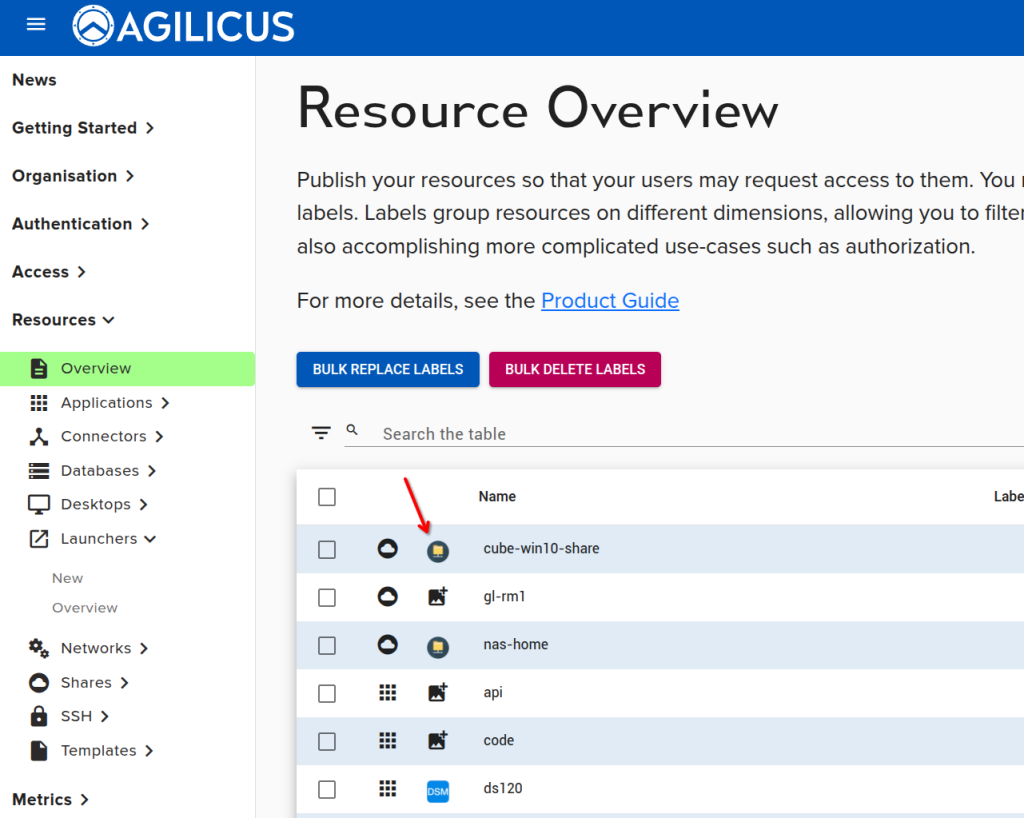
The most common reason that accessing a resource stops working is if the connector providing it goes down, or if the connector loses access to the underlying resources. You can check to see if the connector is up on the connector overview page on the portal. If the connector is up, ensure it has access to the service.
The most common reason for a resource to not show up on the Profile or the user’s desktop start menu is that the user doesn’t have access to it. Even administrators need permission in order to access them! You can check what resources a user has access to by entering a user’s email in the User Audit page on the admin portal (https://admin.__MYDOMAIN__), it’s found under Access->Audits.
Starlink
No, Apple does not provide a server platform since the XServe. The connector is supported on Linux, Windows, various embedded platforms like Synology, pfSense, Mikrotik, etc. To run the connector on an Apple Mac, you may use the Docker instructions (see Install Docker Desktop on Mac).
If you are an enthusiast, consider running the connector under Docker on your Mac.
Yes, via Agilicus AnyX, we can help you with the carrier NAT (CGNAT) issue you might be hitting to access your security camera. See “Seamless Inbound Remote Access via Starlink”, “Starlink Port Forwarding“
See Will this work with my security camera? and “Network Video Recorder Setup” and “Synology Surveillance Station“
See also “3-Steps to Enable Inbound Remote Access: Starlink Remote Cameras“
No. The Agilicus AnyX is a SaaS solution, cloud based. In order to work with your Starlink network, you will install a small piece of software on a single device you already own.
Yes, the end user can use the web-based profile as well as the desktop based launcher. The desktop-based launcher requires OSX 11 (last supported version by Apple) or later.
You can see an animated diagram on the Agilicus Connector page. But in general, this works the same way e.g. a Google Nest thermostat works. Something inside your home network makes a persistent outbound connection to our cloud. When you are away, you will connect to our cloud, it will confirm your identity, and bridge you across these two outbound connections.
Agilicus AnyX is an implementation of Zero Trust, a security best practice. You will use single-sign-on authentication via your Google or Microsoft account (there are no passwords). You can optionally enable multi-factor authentication. All traffic is encrypted with TLS 1.3 HTTPS. You can configure firewall rules in this system for e.g. geo-ip based access, as well as other more complex rules. You will have a full audit trail of who used what when.
Agilicus AnyX is an industrial, business product. The large set of features may make it too complex for a consumer environment.
Agilicus AnyX is an excellent solution for web applications, for SSH (e.g. command line access), for a Share (e.g. file access), and for remote desktop (Microsoft Remote Desktop, VNC). If you have complex networking needs that require layer-3 routing this is probably not the right solution for you.
The Agilicus Connector supports many device types. Windows, Linux, OpenWRT, Synology. You can see more information on the product guide page. In general, the machine will need about 100MB of storage, 20MB of ram to operate.
It is very unlikely the Agilicus Connector will install on your camera.
We do not recommend using the RTSP feature of your camera with Agilicus AnyX. Instead we recommend using the HTTP interface.
Many security cameras have a web interface. If you have a URL you can use from your browser at home, then you can use it while away with Agilicus AnyX.
In most cases, if you have an NVR, this will work. If your camera supports ONVIF, we have specific support for some NVR with that.
Many people use Synology Surveillance Station or Shinobi NVR with Agilicus AnyX.
Sample setups for generic ONVIF cameras are here.
A sample setup for an older Hikvision is here.
