

Connector Details Diagnostic Counters
Diagnostic Counters
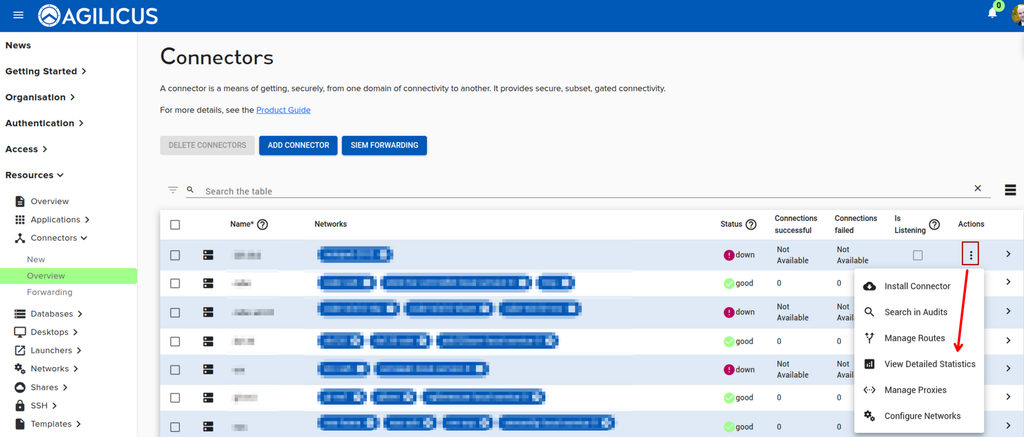
When you have an issue regarding reaching something behind your connector, the first step is to check the connector status (‘good’) on the connectors overview screen. From here we can open the “View Detailed Statistics” from the Actions menu to bring up counters on a per resource basis.
The counters will start refreshing after a few seconds and will continually refresh. The screen looks similar to below.
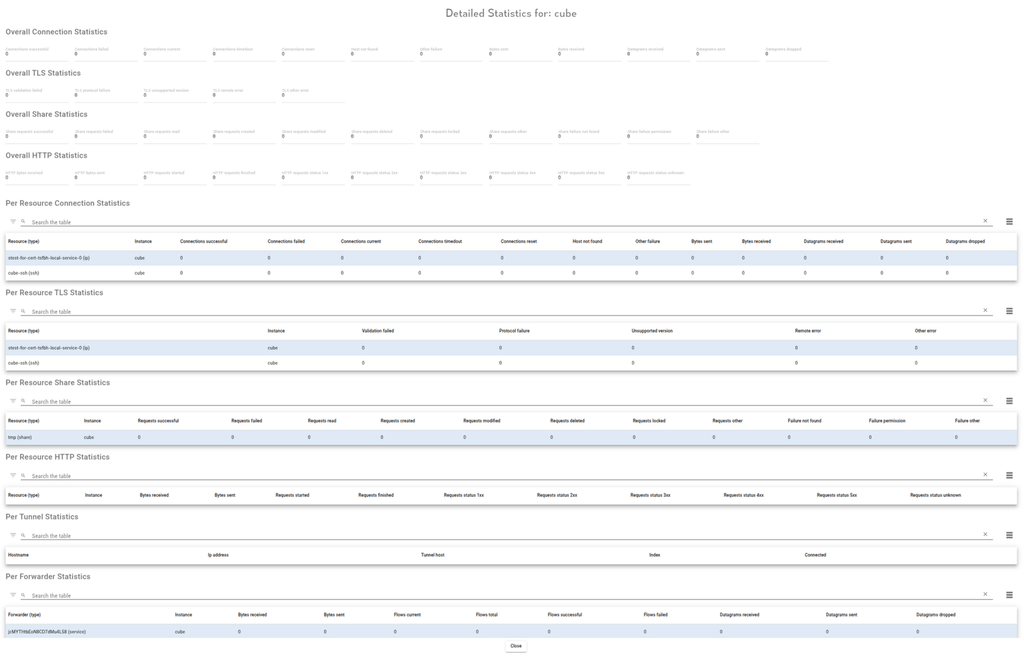
At the top we have overall counters. These are aggregated across all resources. Look at those counters, reproduce your issue, and see which counters increment.
Overall Connection Statistics
These metrics provide a macro-level view of TCP/UDP network health between the AnyX Connector(s) and all upstream resources.
| Statistic | Meaning | Troubleshooting Action |
|---|---|---|
| Connections successful | Total number of successfully established network connections to upstream hosts. | Normal operation. Use as a baseline to identify healthy traffic volume. |
| Connections failed | Attempts to connect to an upstream host that were actively refused or failed. | Check if the target resource is powered on, listening on the specified port, and that local firewalls allow the connector to reach it. |
| Connections current | Active, ongoing connections at this exact moment. | High spikes may indicate a DDoS attempt, traffic surge, or connections hanging. Monitor for sudden, unexplained drops. |
| Connections timedout | The connector attempted to reach an upstream host but received no response within the timeout window. | Check for network routing issues, strict firewall drop rules between the connector and the resource, or severe server lag. |
| Connections reset | Connections that were abruptly closed (RST packet) by the upstream host or intermediate network equipment. | Investigate if the upstream server application is crashing, or if an intrusion detection system (IDS) is terminating the connection. |
| Host not found | The connector cannot resolve the DNS name of the target resource. | Verify the DNS configuration on the machine hosting the AnyX Connector. Ensure it can resolve internal hostnames. |
| Other failure | Catch-all for network errors not covered above (e.g., operating system socket exhaustion). | Check the connector host’s system logs (CPU, memory, file descriptors) for resource exhaustion. |
| Bytes sent | Total data transmitted from the connector to upstream resources. | Normal operation. Monitor for expected throughput. |
| Bytes received | Total data received by the connector from upstream resources. | Normal operation. Monitor for expected throughput. |
| Datagrams received | Total UDP packets received. | Normal operation for UDP-based resources. |
| Datagrams sent | Total UDP packets transmitted. | Normal operation for UDP-based resources. |
| Datagrams dropped | UDP packets that were discarded due to full buffers or network congestion. | High drop rates indicate network saturation or an overwhelmed upstream server. Consider rate-limiting or upgrading network capacity. |
Overall TLS Statistics
These metrics indicate the health of the cryptographic handshake (SSL/TLS) between the Connector and the upstream resources.
| Statistic | Meaning | Troubleshooting Action |
|---|---|---|
| TLS validation failed | The connector rejected the upstream server’s SSL certificate (e.g., expired, self-signed without trust, hostname mismatch). | Verify the SSL certificate on the upstream resource. Update expired certificates or ensure the AnyX connector is configured to trust the internal CA. |
| TLS protocol failure | A breakdown in the TLS handshake process due to malformed packets or protocol violations. | Check for intermediate middleboxes (like deep packet inspection firewalls) interfering with traffic. |
| TLS unsupported version | The connector and the upstream resource cannot agree on a TLS version (e.g., target only supports TLS 1.0, but connector requires TLS 1.2+). | Upgrade the upstream resource to support modern TLS (1.2 or 1.3), or adjust security policies if legacy support is strictly required. |
| TLS remote error | The upstream resource actively aborted the TLS handshake. Often caused by mismatched cipher suites. | Verify that the connector and the resource have overlapping, supported cryptographic cipher suites. |
| TLS other error | Generic TLS errors not caught by specific categories. | Review connector detailed logs for specific cryptographic engine errors. |
Overall Share Statistics
These metrics track file-sharing proxy operations (e.g., SMB/CIFS) passing through the connector.
| Statistic | Meaning | Troubleshooting Action |
|---|---|---|
| Share requests successful | Total number of successfully completed file share operations. | Normal operation. |
| Share requests failed | General failure of a file share operation at the protocol level. | Review target file server logs for SMB/protocol-level errors or network interruptions. |
| Share requests read / created / modified / deleted / locked | Breakdown of specific successful file operations. | Normal operation. Useful for auditing what type of activity is happening most frequently. |
| Share requests other | Miscellaneous share commands (e.g., directory listings, attribute queries). | Normal operation. |
| Share failure not found | A user attempted to access a file or directory that does not exist on the target share. | Verify the requested file path. Inform the user that the file has been moved or deleted. |
| Share failure permission | A user attempted an action (e.g., read, write, delete) they do not have authorization for on the target file server. | Check the target file server’s Access Control Lists (ACLs) and verify the user’s active directory/group permissions. |
| Share failure other | Miscellaneous file share errors (e.g., disk full, file locked by another user). | Check target file server storage capacity and active file locks. |
Overall HTTP Statistics
These metrics provide insight into web application traffic (HTTP/HTTPS) proxied through the connector.
| Statistic | Meaning | Troubleshooting Action |
|---|---|---|
| HTTP bytes received / sent | Total volume of web traffic payload data. | Normal operation. |
| HTTP requests started / finished | Volume of HTTP transactions initiated and completed. | A growing gap between “started” and “finished” indicates hanging requests or an overwhelmed upstream web server. |
| HTTP requests status 1xx | Informational responses (e.g., switching protocols). | Normal operation, usually related to WebSockets. |
| HTTP requests status 2xx | Successful web requests (e.g., 200 OK). | Normal operation. |
| HTTP requests status 3xx | Redirect responses (e.g., 301, 302). | Normal operation. High volumes might indicate a misconfigured application causing redirect loops. |
| HTTP requests status 4xx | Client-side errors (e.g., 401 Unauthorized, 403 Forbidden, 404 Not Found). | Issue is likely on the user’s end (bad URL, lack of authentication). Verify the user is requesting the correct resource path. |
| HTTP requests status 5xx | Server-side errors (e.g., 500 Internal Error, 502 Bad Gateway, 504 Gateway Timeout). | Critical. The upstream web application is failing, crashing, or timing out. Investigate the health and logs of the target web server immediately. |
| HTTP requests status unknown | Non-standard or malformed HTTP response codes returned by the upstream server. | Inspect the upstream application’s code or web server configuration for non-compliant HTTP responses. |
Per Resource Connection Statistics
Note: This isolates connection health to a specific backend resource and high-availability (HA) instance.
| Statistic | Meaning | Troubleshooting Action |
|---|---|---|
| Resource (type) | The specific application, host, or service being accessed. | Use this to identify exactly which backend service is having issues. |
| Instance | The specific High-Availability (HA) connector handling the traffic. | If errors are isolated to one instance, that specific connector host may have local network/hardware issues. Restart or investigate that specific node. |
| Connections successful / failed / current / timedout / reset | TCP network status isolated to this specific resource and connector. | If isolated to one resource, check the routing and firewall rules specifically between the connector and this target host. |
| Host not found / Other failure | Resolution/system errors for this specific resource. | Verify the DNS record specifically for this resource’s internal address. |
| Bytes / Datagrams (received/sent/dropped) | Traffic volume specifically for this resource. | Compare volumes across HA instances to ensure load balancing is working correctly. |
Per Resource TLS Statistics
Note: This isolates cryptographic health to a specific backend resource and HA instance.
| Statistic | Meaning | Troubleshooting Action |
|---|---|---|
| Resource (type) / Instance | Identifies the specific target and HA connector node. | Allows pinpointing SSL issues to a single backend application. |
| Validation failed / Protocol failure / Unsupported version / Remote error / Other error | TLS handshake failures isolated to this specific resource. | Investigate the SSL certificate, TLS versions, and cipher suites specifically configured on this target web server or application. |
Per Resource Share Statistics
Note: This isolates file share health to a specific file server resource and HA instance.
| Statistic | Meaning | Troubleshooting Action |
|---|---|---|
| Resource (type) / Instance | Identifies the specific file share target and HA connector node. | Allows pinpointing SMB/file permission issues to a single file server. |
| Requests (successful/failed/read/created/modified/deleted/locked/other) | File operation volume isolated to this share. | Use to audit activity on a specific sensitive file share. |
| Failure (not found/permission/other) | Access denials or missing files isolated to this share. | Investigate the specific user’s Active Directory permissions on this particular file server. |
Per Resource HTTP Statistics
Note: This isolates web application health to a specific backend web app and HA instance.
| Statistic | Meaning | Troubleshooting Action |
|---|---|---|
| Resource (type) / Instance | Identifies the specific web application target and HA connector node. | Pinpoints web errors to a specific internal site (e.g., Intranet vs. HR Portal). |
| Bytes (received/sent) / Requests (started/finished) | Web traffic volume for this specific application. | Helps identify if a specific internal application is experiencing a traffic surge. |
| Requests status (1xx/2xx/3xx/4xx/5xx/unknown) | HTTP status codes isolated to this application. | If a specific resource shows high 5xx errors, focus troubleshooting solely on that backend web server’s application logs and health. |
Per Tunnel Statistics
These metrics define the health of the connection between the on-premise Connector and the AnyX Cloud infrastructure. If this fails, no user traffic will reach the connector.
| Statistic | Meaning | Troubleshooting Action |
|---|---|---|
| Hostname | The local hostname of the machine running the AnyX Connector agent. | Identifies which machine in your environment is hosting the tunnel. |
| Ip address | The local IP address of the machine running the AnyX Connector. | Useful for local network troubleshooting. |
| Tunnel host | The specific node in the AnyX Cloud that this connector is dialing out to. | Information only. AnyX support may use this to trace cloud-side routing. |
| Index | The numerical ID of the tunnel connection. | Useful for identifying specific multiplexed connections in advanced debug logs. |
| Connected | Boolean status indicating if the tunnel is successfully established to the AnyX Cloud. | Critical. If false, ensure the connector host has outbound internet access (typically TCP 443) and is not being blocked by corporate egress firewalls or web filters. |
Per Forwarder Statistics
These metrics relate to raw TCP/UDP port forwarding services proxying traffic to backend systems.
| Statistic | Meaning | Troubleshooting Action |
|---|---|---|
| Forwarder (type) | Identifies the specific port forwarding service or application. | Identifies the specific raw TCP/UDP application (e.g., SSH, RDP, database protocol). |
| Instance | The specific HA connector handling the forwarded traffic. | Compare HA nodes. If one fails but the other succeeds, investigate the failing node’s local network access. |
| Bytes / Datagrams (received/sent/dropped) | Volume of raw data moving through the forwarder. | Monitor for expected throughput and UDP drops indicating network congestion. |
| Flows current / total | The number of active (current) and historical (total) data streams being forwarded. | Baseline normal activity. Sudden drops in current flows indicate an upstream disconnect. |
| Flows successful / failed | Tracks whether the forwarder successfully opened a socket to the target. | If flows are failing, verify the target database, SSH server, or RDP server is running and allowing connections from the connector’s internal IP. |