Scroll to the bottom for the video covering this topic.
Security features are often disabled because of interactions with older devices and software. There is a relationship between the cost of upgrading those devices and the cost associated with the risk you cannot mitigate without. Many view this risk as linear. If we draw a graph with risk on the left, and number of users on the bottom, we might think the graph looks like this. As we increase the users addressed, we are forced to reduce security to accommodate their older devices.
However, this is a false view. In reality there is an 80:20 rule for most things, here no exception. Recognising that 80% of our users will be using Chrome or Firefox, and, that most of these will be on the last 1 or 2 versions, we can re-draw our graph. We can see that for a constant risk, we can reach the majority of our users. From here the risk grows more rapidly than the number of users reached since we are forced to start disabling features for ever increasingly small groups. Worse, those risks affect both groups (ones with new, and ones with old, software).
This brings up the question, what is really on the table for any change, and, can we make it in strictly economic terms? If we can price the risk, put it in terms of $, it is easier to see, perhaps it is cheaper to upgrade old devices.
Consider a hypothetical organisation. It has invested in the past in smart TV for the meeting rooms. These smart TV are no longer upgradable and only support TLS 1.0 with RC4. This causes the organisation to leave these older security standards enabled on its corporate services, increasing the risk for all users, all devices. Which would cost more? $1000/smart TV, or, a breach in data and the associated reputational damage?
I would like to challenge another assumption, that this curve is linear to begin with. I suggest it’s more Z-shaped, and, that if we could truly assess it, we would design our process and procedures around the 2nd knee in the curve here. Anything passed it, those devices are not worth the risk of reaching.
I gave one example above (TLS version), but there are many such design choices (upgrade of client-software, upgrade of upstream libraries such as jQuery, enabling 2-factor authentication, etc).
Now, you may think this concept of expressing risk in $, and user-reach in $ to be abstract. But I assure you it’s real. It allows you to compare two things that are fungible, to decide where to best spend to obtain the maximal risk:reward ratio.
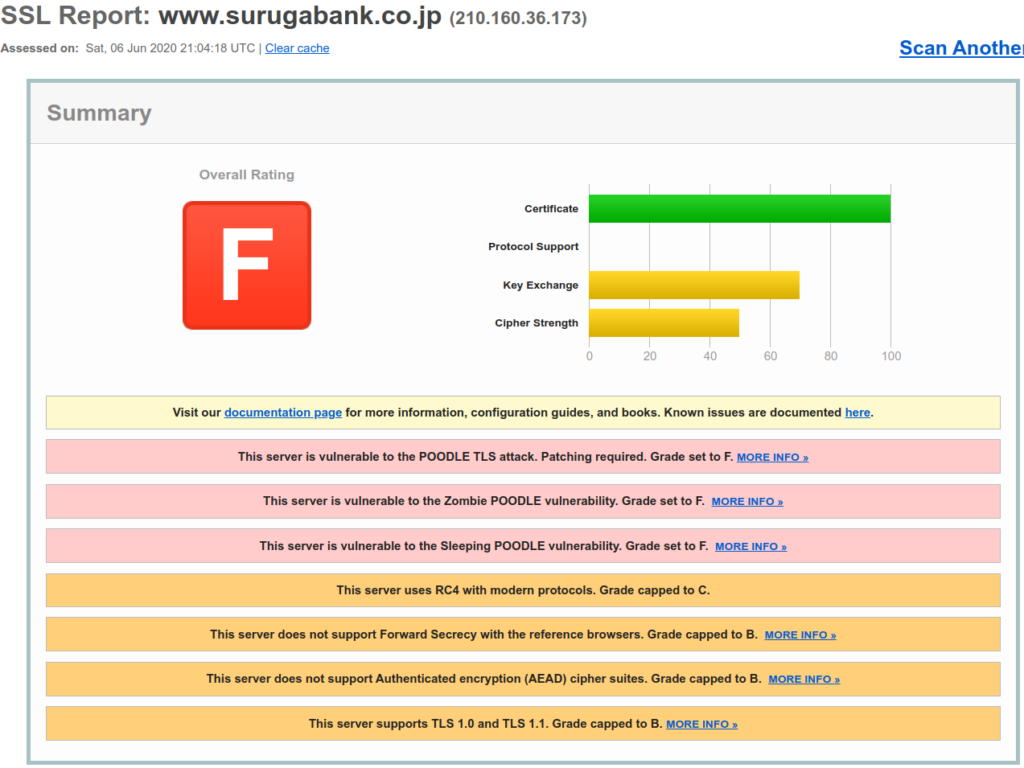
Let’s try an example. Let’s open https://ssllabs.com/ssltest in another tab. Now, on the right hand side, let’s select one of the Recent Worst (or a Recent Best that is less than an A). Feel free to test your own site of course. If we scroll down, we will see the Handshake Simulation and the various client versions. The one I picked was www.surugabank.co.jp. As you can see, it received an F. Is this because of a desire to support old devices? Its doubtful, it seems this bank just doesn’t care.

So let’s maybe select something with a bit higher score. For this I chose licensemanager.sonicwall.com. Here we can see that older protocols are indeed in use, albeit set up correctly. RC4, Weak Diffie-Hellman, TLS 1.0

If we scroll down to the Handshake Simulation, we can see the reason. Many old devices are supported, and some force the use of weak parameters.
